

ICMP & MTR & TCP Port & HTTP Get Prometheus exporter
This exporter gathers either ICMP, MTR, TCP Port or HTTP Get stats and exports them via HTTP for Prometheus consumption.
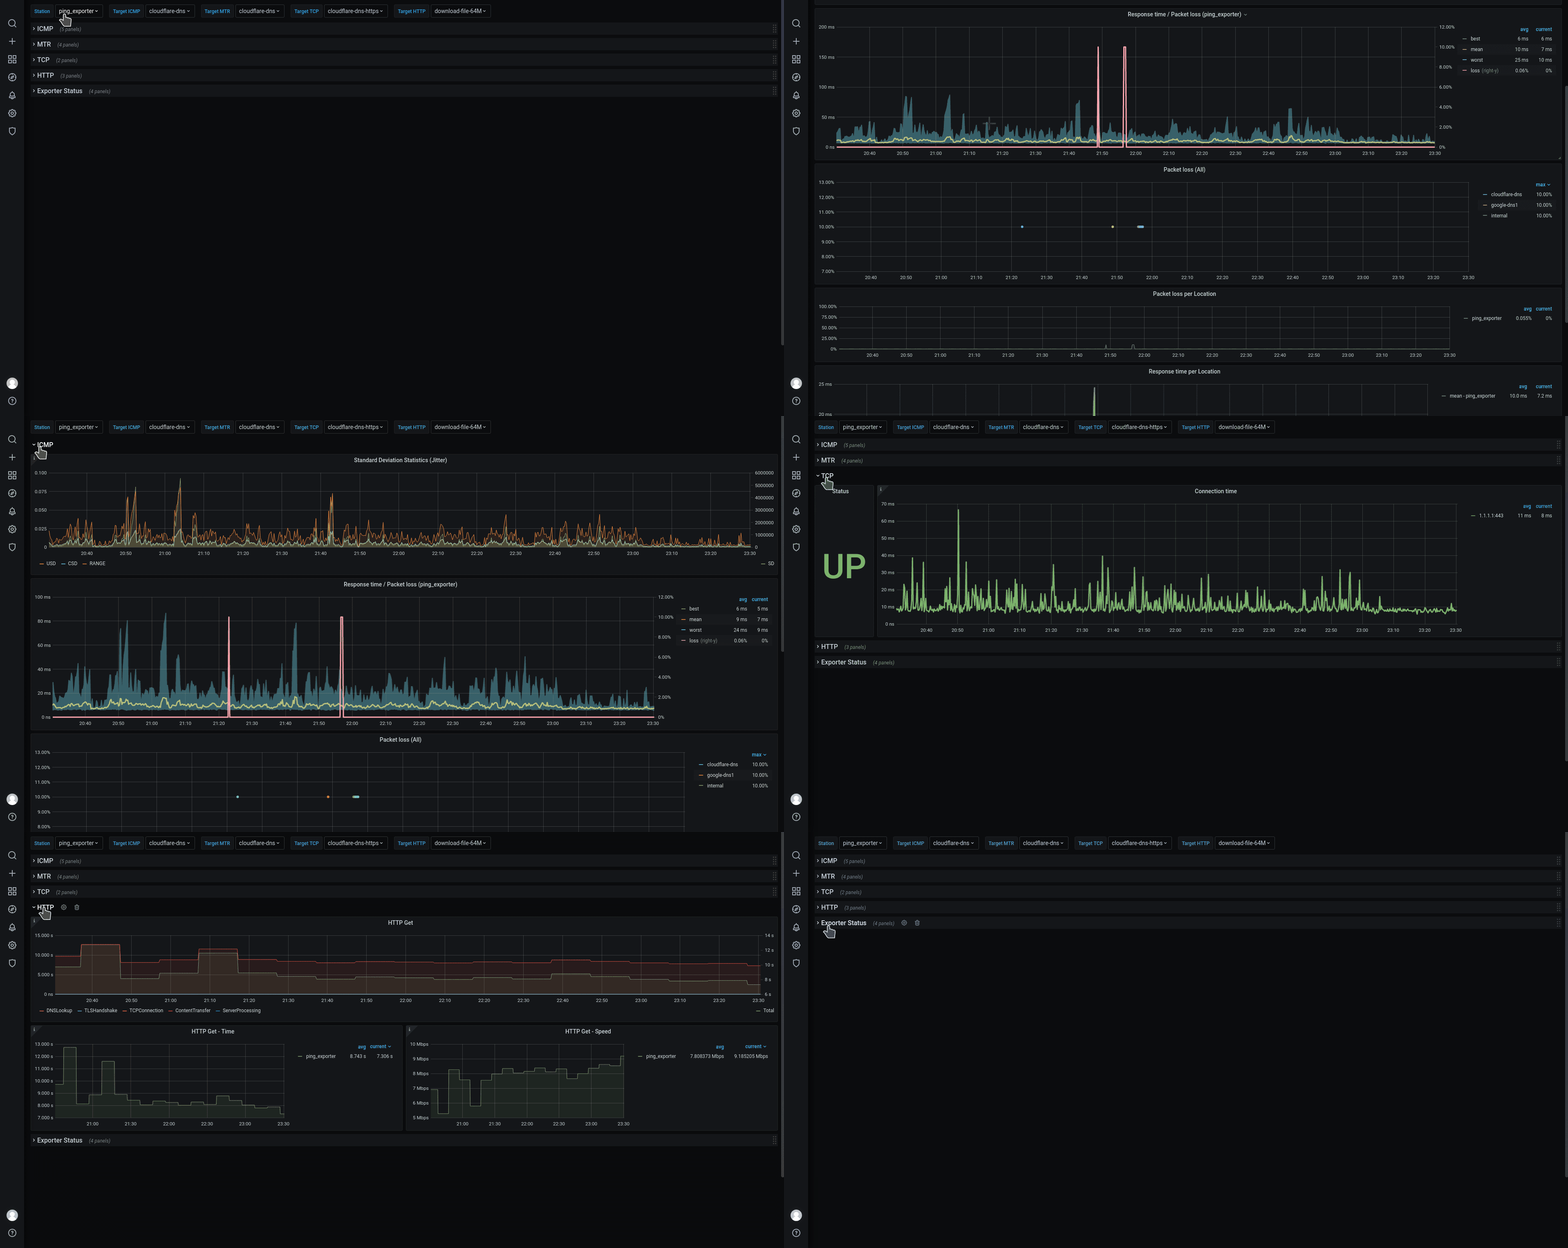
- IPv4 & IPv6 support
- Configuration reloading (by
refreshinterval, bySIGHUPon Linux/macOS, or byPOST /-/reloadon any platform including Windows) - Dynamically Add or Remove targets without affecting the currently running tests
- Automatic update of the target IP when the DNS resolution changes
- Targets can be executed on all hosts or a list of specified ones
probe - Extra labels when defining targets
- Configurable logging levels and format (text or json)
- Configurable DNS Server
- Configurable Source IP per target
source_ip(optional), The IP has to be configured on one of the instance's interfaces - Configurable concurrency control per target type
- High-performance optimizations
- Startup jitter to prevent thundering herd
- Configurable ICMP payload size for PING and MTR probes
- TCP-based MTR traceroute option for firewall-friendly network path discovery
The network_exporter is designed to efficiently handle large numbers of targets with built-in performance optimizations
With default settings (--max-concurrent-jobs=3):
| Target Type | Recommended Limit | Notes |
|---|---|---|
| PING | 10,000 - 15,000 targets | Limited by ICMP ID counter (~65,500 concurrent operations) |
| MTR | 1,000 - 1,500 targets | MTR uses multiple ICMP IDs per operation |
| TCP | 15,000 - 25,000 targets | Short-TTL DNS caching (conf.nameserver_cache_ttl) reduces resolver load |
| HTTPGet | 10,000 - 15,000 targets | Bounded by per-probe connection setup and file descriptors (cross-probe keep-alive reuse is not yet enabled) |
In steady state each target runs exactly one probe per its configured interval.
The --max-concurrent-jobs parameter caps how many probe cycles may overlap for a single target, and overlap only happens when a probe takes longer than that target's interval to finish.
Once the ceiling is reached the per-target run loop applies back-pressure until an in-flight probe completes.
This is a per-target limit, not a total-system one, and there is currently no global concurrency cap.
Worst-case ceiling: targets × max-concurrent-jobs.
This ceiling is reached only if every probe consistently outruns its interval; under normal conditions the real load is close to one in-flight probe per target.
Worst-case concurrent operations by deployment size:
| Targets | max-concurrent-jobs | Worst-case concurrent operations | Notes |
|---|---|---|---|
| 100 | 5 | 100 × 5 = 500 | Reached only if probes routinely exceed their interval |
| 1,000 | 3 | 1,000 × 3 = 3,000 | Recommended default |
| 5,000 | 3 | 5,000 × 3 = 15,000 | Watch the internal metrics (see below) |
| 5,000 | 2 | 5,000 × 2 = 10,000 | Lower overlap for tighter resource bounds |
| 15,000 | 2 | 15,000 × 2 = 30,000 | Large scale, monitor closely |
The tradeoff:
- Higher per-target overlap allows more concurrent samples when a probe is slower than its interval, at the cost of a higher worst-case resource ceiling.
- Lower per-target overlap bounds worst-case resource use more tightly, at the cost of back-pressuring a target whose probes are slower than its interval.
Because a target normally has at most one probe in flight, leaving --max-concurrent-jobs at the default of 3 is right for most deployments.
Change it only when the internal metrics show probes routinely overlapping (see Observing scheduling health).
The exporter exports internal network_exporter_* metrics that let you tune concurrency from measured behavior instead of guesswork.
The bundled Grafana dashboard visualizes all of them in its "Internal Metrics (network_exporter)" row.
network_exporter_probe_duration_secondsversus the configuredinterval: when the p95 duration approaches or exceeds a target type'sinterval, probes of that type will start to overlap.network_exporter_probe_inflight: the live number of overlapping probes per type, which you can compare directly against--max-concurrent-jobs.network_exporter_probe_queue_wait_seconds: how long a scheduled probe waited for a slot, so sustained non-zero values mean probes are hitting the per-target ceiling and being back-pressured.time() - network_exporter_probe_last_completion_timestamp_seconds: a value that keeps climbing indicates the scheduler has stalled for that type.network_exporter_collector_scrape_duration_seconds: how long each/metricsscrape takes, which is the signal to watch as the number of targets grows.
network_exporter_probe_skipped_total is currently always zero and is reserved for a future global scheduler, so it is not yet a live tuning signal.
For most deployments the default is correct; deviate only when the internal metrics show probes overlapping:
# Default: up to 3 overlapping probe cycles per target
./network_exporter --max-concurrent-jobs=3

# Small deployments (<100 targets): allow more overlap per target if probes can exceed their interval
./network_exporter --max-concurrent-jobs=5

# Medium deployments (100-1000 targets): keep the default
./network_exporter --max-concurrent-jobs=3

# Large deployments (1000-5000 targets): keep the default and watch the internal metrics
./network_exporter --max-concurrent-jobs=3

# Very large deployments (>5000 targets): lower the per-target ceiling to bound worst-case resource use
./network_exporter --max-concurrent-jobs=2Rough resource guidance:
- Memory: ~50-100MB baseline plus a few KB per target.
- CPU: Mostly I/O bound.
- File Descriptors: Set
ulimit -nto at least(targets × max-concurrent-jobs) + 1000, which bounds the worst case where every target's probes overlap up to the ceiling.
Example for 5,000 targets:
# Worst-case file descriptors: 5,000 targets × 2 + buffer
ulimit -n 20000

# Lower the per-target overlap ceiling for large scale
./network_exporter --max-concurrent-jobs=2
Example for 15,000 targets:
# Worst-case file descriptors: 15,000 targets × 2 + buffer
ulimit -n 40000

# Conservative per-target overlap ceiling for very large scale
./network_exporter --max-concurrent-jobs=2ping_upExporter stateping_targetsNumber of active targetsping_status: Ping Statusping_rtt_seconds{type=best}: Best round trip time in secondsping_rtt_seconds{type=worst}: Worst round trip time in secondsping_rtt_seconds{type=mean}: Mean round trip time in secondsping_rtt_seconds{type=sum}: Sum round trip time in secondsping_rtt_seconds{type=usd}: Standard deviation without correction in secondsping_rtt_seconds{type=csd}: Standard deviation with correction (Bessel's) in secondsping_rtt_seconds{type=range}: Range in secondsping_rtt_snt_count: Packet sent count totalping_rtt_snt_fail_count: Packet sent fail count totalping_rtt_snt_seconds: Packet sent time total in secondsping_loss_percent: Packet loss in percent
mtr_upExporter statemtr_targetsNumber of active targetsmtr_hopsNumber of route hopsmtr_rtt_seconds{type=last}: Last round trip time in secondsmtr_rtt_seconds{type=best}: Best round trip time in secondsmtr_rtt_seconds{type=worst}: Worst round trip time in secondsmtr_rtt_seconds{type=mean}: Mean round trip time in secondsmtr_rtt_seconds{type=sum}: Sum round trip time in secondsmtr_rtt_seconds{type=usd}: Standard deviation without correction in secondsmtr_rtt_seconds{type=csd}: Standard deviation with correction (Bessel's) in secondsmtr_rtt_seconds{type=range}: Range in secondsmtr_rtt_seconds{type=loss}: Packet loss in percentmtr_rtt_snt_count: Packet sent count totalmtr_rtt_snt_fail_count: Packet sent fail count totalmtr_rtt_snt_seconds: Packet sent time total in seconds
tcp_upExporter statetcp_targetsNumber of active targetstcp_connection_statusConnection Statustcp_connection_secondsConnection time in seconds
http_get_upExporter statehttp_get_targetsNumber of active targetshttp_get_statusHTTP Status Code and Connection Statushttp_get_content_bytesHTTP Get Content Size in byteshttp_get_seconds{type=DNSLookup}: DNSLookup connection drill down time in secondshttp_get_seconds{type=TCPConnection}: TCPConnection connection drill down time in secondshttp_get_seconds{type=TLSHandshake}: TLSHandshake connection drill down time in secondshttp_get_seconds{type=TLSEarliestCertExpiry}: TLSEarliestCertExpiry cert expiration time in epochhttp_get_seconds{type=TLSLastChainExpiry}: TLSLastChainExpiry cert expiration time in epochhttp_get_seconds{type=ServerProcessing}: ServerProcessing connection drill down time in secondshttp_get_seconds{type=ContentTransfer}: ContentTransfer connection drill down time in secondshttp_get_seconds{type=Total}: Total connection time in seconds
Internal self-monitoring metrics describe how the exporter itself is scheduling and executing its checks (as opposed to the check results above).
They are always exported, are independent of the configured targets, and are the primary signal for spotting scheduling and execution bottlenecks as the number of active targets grows.
The type label is the probe kind (ping, mtr, tcp, http).
network_exporter_probe_duration_seconds{type}: Histogram of how long a single probe execution takesnetwork_exporter_probe_total{type,result}: Total probe executions by execution result (successmeans the probe ran without an execution error, independent of target reachability)network_exporter_probe_inflight{type}: Number of probes currently executingnetwork_exporter_probe_queue_wait_seconds{type}: Histogram of how long a scheduled probe waited for a concurrency slot before executing (sustained non-zero values indicate a scheduling/concurrency bottleneck)network_exporter_probe_skipped_total{type,reason}: Total probe cycles skipped instead of executed (reasonissaturationorinflight)network_exporter_probe_last_completion_timestamp_seconds{type}: Unix timestamp of the most recent completed probe (stops advancing if the scheduler stalls for that type)network_exporter_collector_scrape_duration_seconds{collector}: Histogram of how long each collector's/metricsscrape takes
Each metric contains the below labels and additionally the ones added in the configuration file.
name(ALL: The target name)target(ALL: The target defined Hostname or IP)target_ip(ALL: The target resolved IP Address)source_ip(ALL: The source IP Address)port(TCP: The target TCP Port)ttl(MTR: Time to live)path(MTR: Traceroute IP)
The process must run with the necesary linux or docker previlages to be able to perform the necesary tests
apt update
apt install docker
apt install docker.io
touch network_exporter.yml$ goreleaser release --skip=publish --snapshot --clean
$ ls -l artifacts/network_exporter_*6?
# If you want to run it with a non root user
$ sudo setcap 'cap_net_raw,cap_net_admin+eip' artifacts/network_exporter_linux_amd64/network_exporterTo run the network_exporter as a Docker container by builing your own image or using https://hub.docker.com/r/syepes/network_exporter
docker build -t syepes/network_exporter .

# Default mode
docker run --privileged --cap-add NET_ADMIN --cap-add NET_RAW -p 9427:9427 \
  -v $PWD/network_exporter.yml:/app/cfg/network_exporter.yml:ro \
  --name network_exporter syepes/network_exporter

# Debug level
docker run --privileged --cap-add NET_ADMIN --cap-add NET_RAW -p 9427:9427 \
  -v $PWD/network_exporter.yml:/app/cfg/network_exporter.yml:ro \
  --name network_exporter syepes/network_exporter \
  /app/network_exporter --log.level=debug

# Large deployment (e.g., 5000 targets): lower the per-target overlap ceiling
# Worst-case concurrency: 5000 targets × 2 = 10,000 overlapping operations
docker run --privileged --cap-add NET_ADMIN --cap-add NET_RAW -p 9427:9427 \
  -v $PWD/network_exporter.yml:/app/cfg/network_exporter.yml:ro \
  --ulimit nofile=20000:20000 \
  --name network_exporter syepes/network_exporter \
  /app/network_exporter --max-concurrent-jobs=2

# Very large deployment (e.g., 15000 targets): conservative per-target ceiling
# Worst-case concurrency: 15000 targets × 2 = 30,000 overlapping operations
docker run --privileged --cap-add NET_ADMIN --cap-add NET_RAW -p 9427:9427 \
  -v $PWD/network_exporter.yml:/app/cfg/network_exporter.yml:ro \
  --ulimit nofile=40000:40000 \
  --name network_exporter syepes/network_exporter \
  /app/network_exporter --max-concurrent-jobs=2

# Small deployment (e.g., 50 targets): allow more overlap per target
# Worst-case concurrency: 50 targets × 5 = 250 overlapping operations
docker run --privileged --cap-add NET_ADMIN --cap-add NET_RAW -p 9427:9427 \
  -v $PWD/network_exporter.yml:/app/cfg/network_exporter.yml:ro \
  --name network_exporter syepes/network_exporter \
/app/network_exporter --max-concurrent-jobs=5The exporter serves the following endpoints on --web.listen-address (default :9427):
| Method | Path | Description |
|---|---|---|
GET |
/ |
Landing page with a link to the metrics endpoint. |
GET |
/metrics (--web.metrics.path) |
Prometheus metrics. |
POST/PUT |
/-/reload |
Reload the configuration on demand. |
Configuration can be reloaded in three ways.
The refresh interval in the config file reloads automatically when set to a value greater than 0.
On Linux and macOS, sending SIGHUP to the process reloads immediately (kill -HUP <pid>).
On any platform, including Windows, a POST /-/reload request reloads immediately.
POST /-/reload is the only on-demand reload mechanism available on Windows, because Windows has no SIGHUP delivery mechanism.
curl -X POST http://127.0.0.1:9427/-/reloadDetails:
- The endpoint accepts
POSTandPUT; any other method returns405 Method Not Allowedwith anAllow: POST, PUTheader, so a strayGETor link prefetch cannot trigger a reload. - On success it returns
200 OKwith the bodyConfiguration reloaded successfully. - On a config load error it returns
500 Internal Server Errorwith the error message, and the previously loaded configuration stays active. - Reloads from the interval,
SIGHUP, and/-/reloadare serialized, so concurrent triggers cannot race on the target set. - The endpoint is always enabled and shares the metrics listener, so anyone who can reach the metrics port can trigger a reload; place it behind the same network controls you use for
/metrics.
To see all available configuration flags:
./network_exporter -hKey flags:
--config.file- Path to the YAML configuration file (default:/app/cfg/network_exporter.yml)--max-concurrent-jobs- Maximum overlapping probe cycles per target; per-target, not a global cap (default:3)--ipv6- Enable IPv6 support (default:true)--web.listen-address- Address to listen on for HTTP requests (default::9427)--log.level- Logging level: debug, info, warn, error (default:info)--log.format- Logging format: logfmt, json (default:logfmt)--profiling- Enable profiling endpoints (pprof + fgprof) (default:false)
The configuration (YAML) is mainly separated into three sections Main, Protocols and Targets.
The file network_exporter.yml can be either edited before building the docker container or changed it runtime.
# Main Config
conf:
  refresh: 15m
  nameserver: 192.168.0.1:53 # Optional
  nameserver_timeout: 250ms # Optional
  nameserver_cache_ttl: 5s # Optional, short-TTL DNS cache (0 disables)

# Specific Protocol settings
icmp:
  interval: 3s
  timeout: 1s
  count: 6
  payload_size: 56  # Optional, ICMP payload size in bytes (default: 56)
  ttl: 128          # Optional, fixed IP TTL for echo packets (default: 128, range: 1-255)

mtr:
  interval: 3s
  timeout: 500ms
  max-hops: 30
  first-ttl: 1      # Optional, starting TTL of the traceroute (default: 1, range: 1-255, must be < max-hops)
  count: 6
  payload_size: 56  # Optional, ICMP payload size in bytes (default: 56)
  protocol: icmp    # Optional, Protocol to use: "icmp" or "tcp" (default: "icmp")
  tcp_port: 80      # Optional, Default port for TCP traceroute (default: "80")

tcp:
  interval: 3s
  timeout: 1s

http_get:
  interval: 15m
  timeout: 5s

# Target list and settings
targets:
  - name: internal
    host: 192.168.0.1
    type: ICMP
    probe:
      - hostname1
      - hostname2
    labels:
      dc: home
      rack: a1
  - name: google-dns1
    host: 8.8.8.8
    type: ICMP
  - name: google-dns2
    host: 8.8.4.4
    type: MTR
  - name: cloudflare-dns
    host: 1.1.1.1
    type: ICMP+MTR
  - name: cloudflare-dns-https
    host: 1.1.1.1:443
    source_ip: 192.168.1.1
    type: TCP
  - name: download-file-64M
    host: http://test-debit.free.fr/65536.rnd
    type: HTTPGet
  - name: download-file-64M-proxy
    host: http://test-debit.free.fr/65536.rnd
    type: HTTPGet
    proxy: http://localhost:3128
The check type accepts ICMP, MTR, ICMP+MTR, TCP, and HTTPGet.
The combined ICMP and MTR check is order-independent, so ICMP+MTR and MTR+ICMP are equivalent.
A target name is free-form and may contain underscores (for example cloudflare-dns0_1); it is used only as a Prometheus label value and never causes an error.
If you see a warning such as resolving target: lookup <host>: i/o timeout, it refers to a DNS failure for that target's host (tunable with conf.nameserver and conf.nameserver_timeout), not to the target name.
Payload Size
The payload_size parameter (optional) configures the ICMP packet payload size in bytes for ICMP and MTR probes. The default is 56 bytes, which matches the standard ping and traceroute utilities.
- Minimum: 4 bytes (space for sequence number)
- Default: 56 bytes (standard ping/traceroute payload)
- Maximum: Limited by MTU (typically 1472 bytes for IPv4, 1452 for IPv6)
Use cases:
- Path MTU Discovery: Test different packet sizes to identify MTU issues
- Network Stress Testing: Use larger payloads to simulate higher bandwidth usage
- Performance Testing: Measure latency with varying packet sizes
icmp:
  interval: 3s
  timeout: 1s
  count: 6
  payload_size: 56    # Standard size (default)

mtr:
  interval: 3s
  timeout: 500ms
  max-hops: 30
  count: 6
  payload_size: 1400  # Larger payload for MTU testing
MTR Protocol Selection
The protocol parameter (optional) allows you to choose between ICMP and TCP for MTR (traceroute) operations. The default is icmp, which is the standard traceroute protocol.
ICMP Protocol (default):
mtr:
  protocol: icmp     # Standard ICMP Echo traceroute
  payload_size: 56
TCP Protocol:
mtr:
  protocol: tcp      # TCP SYN-based traceroute
  tcp_port: 443     # Default port for TCP traceroute
Key Differences:
| Feature | ICMP Traceroute | TCP Traceroute |
|---|---|---|
| Protocol | ICMP Echo Request | TCP SYN packets |
| Firewall Bypass | Often blocked by firewalls | More likely to pass through firewalls |
| Path Accuracy | May take different path | Follows actual application traffic path |
| Port Required | No | Yes (default: 80) |
| Use Case | General network diagnosis | Testing connectivity to specific services |
TCP Traceroute Benefits:
- Firewall-Friendly: Many firewalls block ICMP/UDP but allow TCP traffic
- Real-World Path: Tests the actual path TCP connections will take
- Service-Specific: Can test connectivity to specific ports (80, 443, etc.)
TCP Port Configuration:
You can specify the port in two ways:
-
Global default (tcp_port in config):
mtr:
  protocol: tcp
  tcp_port: 443    # All MTR targets use port 443 by default

targets:
  - name: google-https
    host: google.com
    type: MTR
-
Per-target port (in host string):
mtr:
  protocol: tcp
  tcp_port: 80     # Default fallback

targets:
  - name: web-service
    host: example.com:443    # Explicit port 443
    type: MTR

  - name: api-service
    host: api.example.com:8080   # Explicit port 8080
    type: MTR

  - name: default-service
    host: service.com       # Uses tcp_port default (80)
    type: MTR
Example Configurations:
# ICMP traceroute (default behavior)
mtr:
  interval: 5s
  timeout: 4s
  max-hops: 30
  count: 10
  protocol: icmp

targets:
  - name: google-dns
    host: 8.8.8.8
    type: MTR

# TCP traceroute to HTTPS services
mtr:
  interval: 5s
  timeout: 4s
  max-hops: 30
  count: 10
  protocol: tcp
  tcp_port: 443

targets:
  - name: website-https
    host: example.com:443
    type: MTR

  - name: api-server
    host: api.example.com:8443
    type: MTR

# Mixed: Use ICMP but support custom ports per target
mtr:
  interval: 5s
  timeout: 4s
  max-hops: 30
  count: 10
  protocol: tcp
  tcp_port: 80      # Default

targets:
  - name: web-http
    host: example.com        # Uses port 80
    type: MTR

  - name: web-https
    host: example.com:443    # Uses port 443
    type: MTR
Initial TTL / Cilium
By default MTR traceroute emits its first probe with an IP TTL of 1 (to discover the first hop), and ICMP ping uses a fixed TTL of 128. In Kubernetes clusters running the Cilium CNI, probe packets that leave with a very low IP TTL are counted as "Invalid Packets" and dropped by the Cilium datapath before they reach the wire. Two options let operators raise the initial TTL so the probes traverse Cilium.
icmp.ttlsets a fixed IP TTL for every ICMP echo packet. Default is 128 (unchanged behavior), valid range is 1-255.mtr.first-ttlsets the starting TTL of the traceroute, analogous totraceroute --first-ttl. Default is 1 (unchanged behavior), valid range is 1-255, and it must be less thanmtr.max-hops. Note that hops below the start TTL are intentionally not reported, so raising it skips the near-side hops (which is exactly what avoids the Cilium drops).
Only ICMP and MTR emit low TTLs; plain TCP and HTTP probes use the OS stack default and are unaffected.
MTR with protocol: tcp also honors first-ttl.
icmp:
  count: 6
  ttl: 64           # Raised so Cilium does not drop the probe as an Invalid Packet

mtr:
  max-hops: 30
  first-ttl: 5      # Skip the low-TTL hops that Cilium drops
  count: 6
A dedicated, ready-to-use example is available at dist/deploy/cfg/network_exporter_cilium.yml.
Source IP
source_ip parameter will try to assign IP for request sent to specific target. This IP has to be configure on one of the interfaces of the OS.
Supported for all types of the checks
  - name: server3.example.com:9427
    host: server3.example.com:9427
    type: TCP
    source_ip: 192.168.1.1
Note: Domain names are resolved (regularly) to their corresponding A and AAAA records (IPv4 and IPv6).
By default if not configured, network_exporter uses the system resolver to translate domain names to IP addresses.
You can also override the DNS resolver address by specifying the conf.nameserver configuration setting.
Resolutions are cached for a short window (conf.nameserver_cache_ttl, default 5s) so the periodic add/delete/change-detection passes collapse to a single lookup per host per refresh round instead of resolving every host several times; set it to 0 to disable caching.
SRV records:
If the host field of a target contains a SRV record with the format _<service>._<protocol>.<domain> it will be resolved, all it's A records will be added (dynamically) as separate targets with name and host of the this A record.
Every field of the parent target with a SRV record will be inherited by sub targets except name and host
SRV record supported for ICMP/MTR/TCP target types. TCP SRV record specifcs:
- Target type should be
TCPand_protocolpart in the SRV record should be_tcpas well - Port will be taken from the 3rd number, just before the hostname
TCP SRV example
_connectivity-check._tcp.example.com. 86400 IN SRV 10 5 80 server.example.com.
_connectivity-check._tcp.example.com. 86400 IN SRV 10 5 443 server2.example.com.
_connectivity-check._tcp.example.com. 86400 IN SRV 10 5 9247 server3.example.com.
ICMP SRV example
_connectivity-check._icmp.example.com. 86400 IN SRV 10 5 8 server.example.com.
_connectivity-check._icmp.example.com. 86400 IN SRV 10 5 8 server2.example.com.
_connectivity-check._icmp.example.com. 86400 IN SRV 10 5 8 server3.example.com.
Configuration reference
  - name: test-srv-record
    host: _connectivity-check._icmp.example.com
    type: ICMP
  - name: test-srv-record
    host: _connectivity-check._tcp_.example.com
    type: TCP
Will be resolved to 3 separate targets:
  - name: server.example.com
    host: server.example.com
    type: ICMP
  - name: server2.example.com
    host: server2.example.com
    type: ICMP
  - name: server3.example.com
    host: server3.example.com
    type: ICMP
  - name: server.example.com:80
    host: server.example.com:80
    type: TCP
  - name: server2.example.com:443
    host: server2.example.com:443
    type: TCP
  - name: server3.example.com:9427
    host: server3.example.com:9427
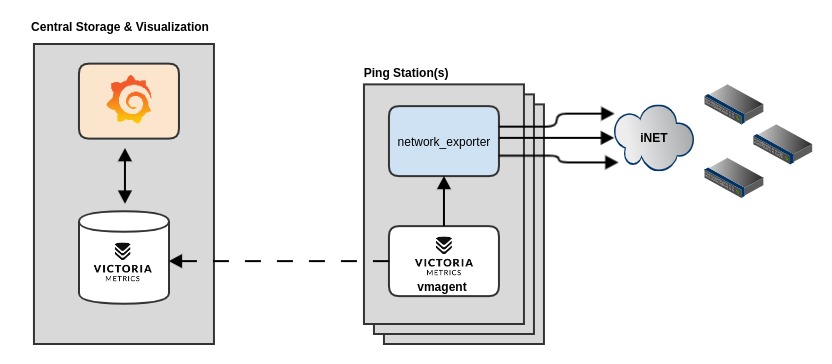
type: TCPThis deployment example will permit you to have as many Ping Stations as you need (LAN or WIFI) devices but at the same time decoupling the data collection from the storage and visualization. This docker compose will deploy and configure all the components plus setup Grafana with the Datasource and Dashboard
If you have any idea for an improvement or find a bug do not hesitate in opening an issue, just simply fork and create a pull-request to help improve the exporter.
All content is distributed under the Apache 2.0 License Copyright © 2020-2024, Sebastian YEPES