Das servers typically provide data relevant to space plasma and magnetospheric physics research. To retrieve data, an HTTP GET request is posted to a das server by a client program and a self-describing stream of data values covering the requested time range, at the requested time resolution, is provided in the response body. This package, das2py provides an efficient space physics data client for python. Streams are parsed and stored as NumPy arrays using a C extension, avoiding data copies and conversions.

The short version, for people upgrading from 2.3:
- The package is
das3now. It reads das3 streams, so it's named for them.import das2keeps working as an alias and points at the very same modules, so old and new code mix without a fuss. The pip name is stilldas2py. Python 2.7 and 3.x are both fine;das3says nothing about the interpreter. - Composite values. Vectors, rotation matrices, quaternions and complex
pairs come through as one variable with a trailing internal shape, so a
vector over N records is an (N, 3) array in a shape (N,) dataset. Each
variable carries its
<ops>formalism as a dict (var.ops), one label per component (var.labels), andvar.extShape()/var.intrShape()for the two halves of the shape. - Sequences are materialized. A coordinate defined by a
<sequence>in the stream header arrives as a real array now instead of going missing. - Dimensions know what they are.
dim.kindis'coord'or'data', andds.coordKeys()/ds.dataKeys()list one kind at a time. - Tidier names.
dir(das3)shows the public API and nothing else. A few methods were renamed to match the rest:DasTime.fromString,DasTime.roundDoy,Dimension.hasPropandhasPropVal(replacingpropEq),Source.getProtoandinfoProto.DasTime.from_stringstill works and warns.Quantity.to_valuekeeps its snake_case on purpose, since that's AstroPy's name for the same thing. - das_verify checks more. Index counts against the dataset rank, one
units=per composite, and<sequence>counts against the internal shape, none of which an XML schema can express. - Not yet: ragged arrays (variable length records) still don't convert to ndarrays. das2C reads them; das2py stops at the conversion.
As of version 3.0 the package is das3, named for the das3 stream format.
It runs on Python 2.7 and 3.x alike, and the pip package name is unchanged.
import das2 still works: it is an alias that returns the very same
modules, so old and new code mix freely. The alias raises a
PendingDeprecationWarning, which Python hides by default. To find the
places in a project that still use the old name, run it with that warning
promoted to an error:
python -W error::PendingDeprecationWarning your_script.pyPre-build versions of das2py are available from Anaconda. If you're working in an Anoconda or Miniconda python 3 environment these are easier to install as no C compiler is required. To install the conda package run the command:
(base) $ conda install -c dasdevelopers das2pyThe anaconda package automatically pulls in das2C, pycdf, and pthreads4w as needed.
If this works then test using:
(base) $ wget https://raw.githubusercontent.com/das-developers/das2py/master/examples/ex05_mex_marsis_query_by_angle.py
(base) $ python ex02_galileo_pws_spectra.py
If this command produces a plot similar to the following...
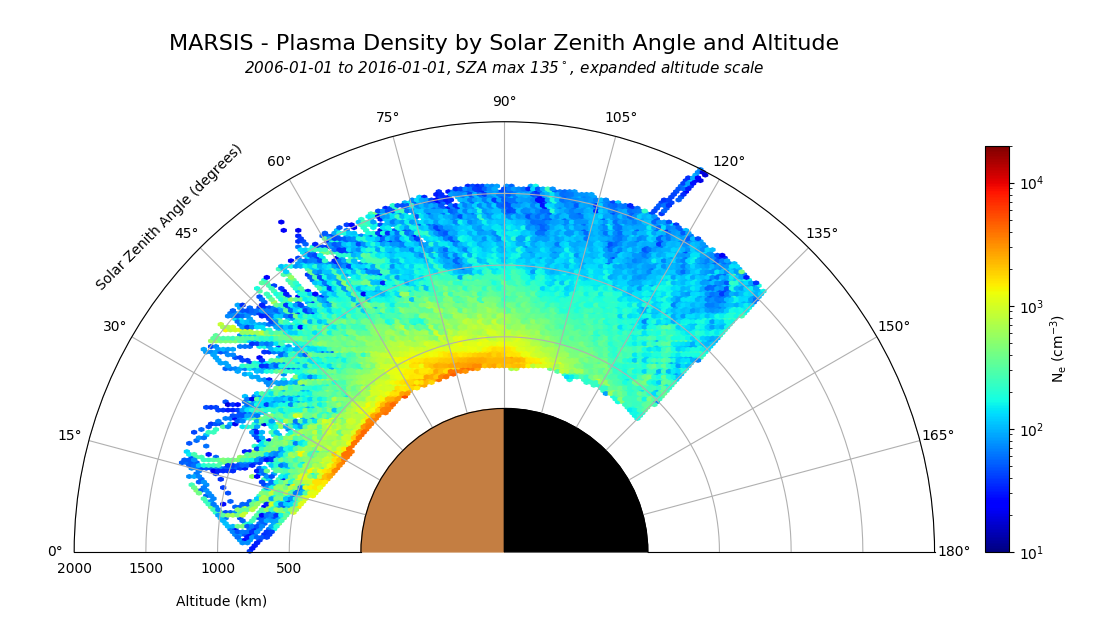
...then das2py is installed, and you can skip building the software and head straight the example program below.
Compilation and installation of das2py is regularly tested on Linux under both Python 2 (still) and Python 3. Testing on Windows and MacOS is less frequent, and then only under Python 3. The following packages are required to build das2py and all dependencies:
-
Get system software packages.
Rocky Linux or Compatable
dnf install git gcc expat-devel fftw-devel openssl-devel python3-devel
Debian Linux or Compatable
apt install gcc git libexpat-dev libfftw3-dev libssl-dev python3-dev
-
Get both source trees in parallel directories. Unless the
DAS2Cenvironment variable is set, the makefile will look for das2C in a parallel directory.mkdir -p git && cd git git clone https://github.com/das-developers/das2C.git git clone https://github.com/das-developers/das2py.git
-
Build and test sources against a specific version of python. The makefiles will automatically find python if
PY_BINis not defined, but providing an explicit path avoids confusion down the road. For old Python2 builds, PY_BIN is required, as Python3 will be built by default.Note that the
makecommand is not needed to build das2py. Python invocations could be typed manually, but it's saves time, encourages testing, and we need it for building das2C anyway.cd git/das2C make CDF=yes SPICE=yes # das2py needs spice and cdf utils make CDF=yes SPICE=yes test cd ../ cd ../das2py make PY_BIN=/path/to/python # See PY_BIN note above make PY_BIN=/path/to/python test # optional, but recommended make PY_BIN=/path/to/python example # optional, but recommended cd ../
-
Install into your desired python environment.
/path/to/python -m pip install ./dist/das2py-*.whl

# or

make PY_BIN=/path/to/python install
To build from source under anaconda, or for Windows or MacOS hosts and to interact with PyPI see the alternate instructions in buildfiles/ReadMe.md
The following small program demonstrates how to query for data and generate a plot using das2py.
import das3
src = das3.get_source( 'tag:das2.org,2012:site:/uiowa/galileo/pws/survey_electric/das2' )
dataset = src.get( {'time' : ('1997-05-07T15:00', '1997-05-07T17:00', 4.0)} )[0] - Servers come and go. The federated catalog provides stability for application code by maping URIs to data sources.
- Browse for URIs using a das2 catalog browser, or using das2py to get the root node (see example 11).
print(dataset)

vX = dataset['time']['center']
vY = dataset['frequency']['center']
vZ = dataset['electric']['center'] - Datasets contain dimensions. Dimensions contain variables. Each variable in a dimension serves a purpose, the most common is to define the center point of a coordinate or measurement.
- Array dimensions are not confused with physical dimensions. Dataset meaning is not tied to any particular array morphology.
import matplotlib.pyplot as pyplot
import matplotlib.colors as colors

fig, ax = pyplot.subplots()
scaleZ = colors.LogNorm(vmin=vZ.array.min(), vmax=vZ.array.max())
ax.pcolormesh(vX.array, vY.array, vZ.array, norm=scaleZ, cmap='jet')
pyplot.show() Please use the github.com issue tracker report any problems with the library. If you've fixed a bug, 1) thanks!, 2) please send a pull request so that your updates can be merged into the main project.