Skip to content

Real-time threads: periodic SCHED_FIFO loops the collector never stops - #6138

Merged
shai-almog merged 13 commits into
masterfrom
realtime-threads
Nov 1, 2026
Merged

shai-almog merged 13 commits into
masterfrom
realtime-threads

Conversation

@shai-almog

Copy link
Copy Markdown
Collaborator

Adds com.codename1.realtime: periodic real-time threads for control loops on (PREEMPT_RT) Linux, the embedded port and the backend.

  • Scheduling: SCHED_FIFO priority, CPU pinning plus isolation (the core is given back when the thread ends), mlockall(MCL_ONFAULT), and priority-inheriting VM mutexes. Release is on an absolute clock, with missed-period reporting and latency/execution statistics plus a histogram.
  • Collector isolation: a real-time thread is released as soon as its stack is scanned (sound because SATB is armed first), and no stop-the-world cycle runs while one is alive.
  • No allocation in a cycle:
    • Build time: RealtimeAllocationVerifier fails the build on allocation reachable from cycle()/periodsMissed(), unless it is marked @AllocationAllowed.
    • Run time: the thread's page cache is swapped out, so an allocation the build could not see throws RealtimeAllocationError naming the class. Per-period budgets are supported, and the check is re-armed each period, so it stays on even if the cycle catches the error itself.
  • setMemoryLimit: ordinary threads get OutOfMemoryError instead of a stalled collector. The limit is measured on resident memory, after collections and on the allocation slow path.
  • Other platforms: the simulator and other ports run the loop best-effort.
  • Docs: the developer guide gets a new chapter, Realtime.asciidoc, linked from Embedded Linux.
  • CI: vm/backend/demo/rtcheck runs in embedded-linux.yml on the arm64 runner, as root. It covers latency under GC churn, the hidden-allocation trap, budgets, a cycle that catches the error, and the memory limit. The latency bound is loose (20ms) because runners are not PREEMPT_RT.

Verified locally on macOS and in an arm64 Linux container: rtcheck passes. The SpotBugs, PMD, cast-semantics, header, ASCII and control-character gates pass, and RealtimeAllocationVerifierTest passes 7/7.

🤖 Generated with Claude Code

shai-almog and others added 4 commits October 30, 2026 06:21
com.codename1.realtime runs a RealtimeTask on a thread of its own, released
on an absolute clock, on PREEMPT_RT (and any) Linux and on the backend:

- SCHED_FIFO priority, CPU pinning and isolation, mlockall(MCL_ONFAULT),
  priority-inheriting VM mutexes; statistics with a latency histogram.
- The collector releases a real-time thread as soon as its stack is
  scanned (SATB keeps it sound) and never enters stop-the-world phases
  while one runs.
- No allocation in a cycle: RealtimeAllocationVerifier fails the build on
  allocation reachable from cycle()/periodsMissed(); at run time the
  thread's page cache is swapped out, so an allocation the build could not
  see throws RealtimeAllocationError naming the class.
- setMemoryLimit: ordinary threads get OutOfMemoryError instead of a
  struggling collector once resident memory is over the limit.
- The simulator and other ports run the loop best-effort.

vm/backend/demo/rtcheck is the check, run on the arm64 runner by
embedded-linux.yml; developer guide chapter Realtime.asciidoc.

Co-Authored-By: Claude Opus 5.5 <noreply@anthropic.com>
…e sections

Red-team round 1: an allocation inside a non-zero budget refilled the budget,
so only a budget of 0 was enforced (rtcheck now checks budget 2). Isolation now
returns the core to the moved threads when the real-time thread ends; a virtual
thread resumed from a trapped carrier gets the real page array; the RSS sample
counter no longer drops bytes. Guide: parameters, life cycle, features.

Co-Authored-By: Claude Opus 5.5 <noreply@anthropic.com>
…rs statistics and porting

Red-team round 2: the over-budget path lifted the trap to build the error and
nothing re-armed it, so a cycle catching RealtimeAllocationError allocated
unchecked from then on. The trap is re-armed every period (rtcheck: catcher).

Co-Authored-By: Claude Opus 5.5 <noreply@anthropic.com>
@github-actions

Copy link
Copy Markdown
Contributor

Cloudflare Preview

shai-almog and others added 2 commits October 30, 2026 18:16
…e and IDEs

- cn1:buildLinuxLocal / buildLinuxLocal, cn1:runOnDevice / cn1RunOnDevice and
  cn1:device-logs / cn1DeviceLogs; -Dcn1.board names the board and turns on
  the embedded build.
- The executable survives the builder's temp dir (linux/target/linux-native).
- A cross build with no cross compiler fails instead of using the host cc.
- The device refuses a binary for another architecture before installing it;
  the service gets LimitRTPRIO/LimitMEMLOCK for real-time threads.
- Archetype: build.sh/build.bat commands and IntelliJ, VS Code, NetBeans and
  Eclipse entries for Linux Local Build, Run on Device and Device Logs.
- CI: the real-time step installs the backend; the guide's motor loop is an
  included, compiled snippet.

Co-Authored-By: Claude Opus 5.5 <noreply@anthropic.com>
…r commands

Co-Authored-By: Claude Opus 5.5 <noreply@anthropic.com>
@github-actions

github-actions Bot commented Oct 30, 2026 •

Copy link
Copy Markdown
Contributor

Developer Guide build artifacts are available for download from this workflow run:

Developer Guide quality checks:

  • AsciiDoc linter: No issues found (report)
  • Vale: No alerts found (report)
  • Paragraph capitalization: No paragraph capitalization issues (report)
  • LanguageTool: No grammar matches (report)
  • Image references: No unused images detected (report)

shai-almog and others added 2 commits October 30, 2026 21:43
Co-Authored-By: Claude Opus 5.5 <noreply@anthropic.com>
@github-actions

github-actions Bot commented Oct 30, 2026 •

Copy link
Copy Markdown
Contributor

✅ Continuous Quality Report

Test & Coverage

Static Analysis

  • SpotBugs [Report archive]
    • ✅ ByteCodeTranslator: 0 findings (no issues)
    • ✅ android: 0 findings (no issues)
    • ✅ android-compat: 0 findings (no issues)
    • ✅ android-res-compiler: 0 findings (no issues)
    • ✅ backend: 0 findings (no issues)
    • ✅ backend-test: 0 findings (no issues)
    • ✅ build-engine: 0 findings (no issues)
    • ✅ build-hint-catalog: 0 findings (no issues)
    • ✅ build-hint-tools: 0 findings (no issues)
    • ✅ codenameone-gradle-plugin: 0 findings (no issues)
    • ✅ codenameone-maven-plugin: 0 findings (no issues)
    • ✅ compose-compat: 0 findings (no issues)
    • ✅ core-unittests: 0 findings (no issues)
    • ✅ desktop-compat-runtime: 0 findings (no issues)
    • ✅ fxml-compiler: 0 findings (no issues)
    • ✅ ios: 0 findings (no issues)
    • ✅ javac: 0 findings (no issues)
    • ✅ javafx-compat: 0 findings (no issues)
    • ✅ project-model: 0 findings (no issues)
    • ✅ swing-compat: 0 findings (no issues)
  • ✅ PMD: 0 findings (no issues) [Report archive]
  • ✅ Checkstyle: 0 findings (no issues) [Report archive]

Generated automatically by the PR CI workflow.

@github-actions

github-actions Bot commented Oct 30, 2026 •

Copy link
Copy Markdown
Contributor

✅ ByteCodeTranslator Quality Report

Test & Coverage

  • ✅ Tests: 908 total, 0 failed, 55 skipped

Benchmark Results

  • Execution Time: 7118 ms

  • Hotspots (Top 20 sampled methods):

    • 11.59% java.lang.System.identityHashCode (124 samples)
    • 8.13% com.codename1.tools.translator.IteratorEscape.ctorOnlyStoresParamsIntoThis (87 samples)
    • 5.23% java.lang.Object.hashCode (56 samples)
    • 5.14% java.util.ArrayList.indexOf (55 samples)
    • 4.30% com.codename1.tools.translator.BytecodeMethod.equals (46 samples)
    • 4.11% com.codename1.tools.translator.classfile.analysis.Frame.execute (44 samples)
    • 2.90% java.lang.StringBuilder.append (31 samples)
    • 2.06% com.codename1.tools.translator.IteratorEscape.mangle (22 samples)
    • 1.96% com.codename1.tools.translator.bytecodes.Invoke.resolveDirectTarget (21 samples)
    • 1.68% java.lang.String.equals (18 samples)
    • 1.59% com.codename1.tools.translator.BytecodeMethod.updateInlinableFieldDependencies (17 samples)
    • 1.40% java.io.FileOutputStream.writeBytes (15 samples)
    • 1.40% java.util.HashMap.hash (15 samples)
    • 1.31% com.codename1.tools.translator.ByteCodeClass.fillVirtualMethodTable (14 samples)
    • 1.31% com.codename1.tools.translator.ByteCodeClass.hasDeclaredMethod (14 samples)
    • 1.12% com.codename1.tools.translator.Parser.cullMethods (12 samples)
    • 1.03% java.util.AbstractCollection.containsAll (11 samples)
    • 0.93% com.codename1.tools.translator.JavascriptReachability.enqueueResolved (10 samples)
    • 0.84% com.codename1.tools.translator.DeadFieldElimination.run (9 samples)
    • 0.84% com.codename1.tools.translator.BytecodeMethod.optimize (9 samples)
  • ⚠️ Coverage report not generated.

Static Analysis

  • ✅ SpotBugs: no findings (report was not generated by the build).
  • ⚠️ PMD report not generated.
  • ⚠️ Checkstyle report not generated.

Generated automatically by the PR CI workflow.

@github-actions

github-actions Bot commented Oct 30, 2026 •

Copy link
Copy Markdown
Contributor

Flutter vs Codename One

Same application, built both ways: Flutter's AOT compile of the gallery, and the identical Dart source transpiled to Java on Codename One. Lower is better for every metric, so a ratio above 1.00x means Codename One is ahead by that factor.

android

9 interleaved rounds; host load 1.32, 2.03, 1.67

Metric Codename One Flutter Ratio Winner
Installed size 78.3 MB 95.8 MB 1.22x Codename One
Executable code 4.7 MB 20.6 MB 4.35x Codename One
Download size (zipped) 78.3 MB 95.8 MB 1.22x Codename One
Cold start to first frame on screen 358 ms 1511 ms 3.77x Codename One
Memory at rest 47.2 MB 87.7 MB 1.86x Codename One

Start-up and memory at rest are judged round by round: the ratio is the median of the per-round ratios, each from two launches made back to back, and the times and sizes shown are each side's median, so the ratio need not equal their quotient. Codename One was ahead in 9 of 9 rounds on cold start to first frame on screen; 9 of 9 rounds on memory at rest.

Compute -- the VM workloads (vm/benchmarks), run inside each app; time is the best of the app's own repetitions, higher ratio means Codename One is faster.

Workload Codename One Flutter Ratio
intArithmetic 97 ms 212 ms 2.19x
longArithmetic 64 ms 67 ms 1.05x
mathTranscendental 279 ms 363 ms 1.30x
arraySequential 30 ms 41 ms 1.37x
arrayRandom 255 ms 311 ms 1.22x
objectAllocation 72 ms 44 ms 0.61x
valueEscape 8 ms 8 ms 1.00x
hashMapChurn 144 ms 299 ms 2.08x
stringBuilding 96 ms 126 ms 1.31x
recursion 82 ms 302 ms 3.68x
quicksortBench 148 ms 170 ms 1.15x
Geometric mean 1.38x

Gate: within tolerance against scripts/flutter-bench/baseline.

Android sizes are for the arm64-v8a slice a phone is delivered, on both sides; Flutter's release apk carries three ABIs and would otherwise count its engine about three times.
Android start-up and memory come from an x86_64 emulator with a software GPU. They compare the two runtimes on one machine; they are not phone timings, and a renderer that leans on the GPU is penalised more there.
This platform's adapter has not been exercised end to end before; treat the first published run as the thing under review.

ios

9 interleaved rounds; host load 36.14, 35.02, 26.57

Metric Codename One Flutter Ratio Winner
Installed size 108.5 MB 110.5 MB 1.02x Codename One
Executable code 17.4 MB 19.1 MB 1.09x Codename One
Download size (zipped) 80.0 MB 81.9 MB 1.02x Codename One
Cold start to first frame on screen -- -- -- not measured
Memory at rest -- -- -- not measured

Compute -- the VM workloads (vm/benchmarks), run inside each app; time is the best of the app's own repetitions, higher ratio means Codename One is faster.

Not measured: iOS compute is not measured: a device build needs signed hardware, and on the simulator Flutter runs its JIT debug engine rather than AOT code. The macOS row runs the same ParparVM and Dart AOT compilers on the same Apple silicon.

Gate: within tolerance against scripts/flutter-bench/baseline.

iOS start-up and memory are not measured here: Flutter cannot AOT-compile for the simulator, so a simulator run would time a JIT debug build against a release build. Sizes come from release device bundles; timings need signed hardware.
This platform's adapter has not been exercised end to end before; treat the first published run as the thing under review.

javascript

9 interleaved rounds; host load 2.4, 1.2, 0.48

Metric Codename One Flutter Ratio Winner
Installed size 104.4 MB 122.5 MB 1.17x Codename One
Executable code 13.3 MB 25.2 MB 1.89x Codename One
Download size (zipped) 76.4 MB 84.1 MB 1.10x Codename One
Cold start to first frame on screen -- -- -- not measured
Memory at rest -- -- -- not measured

Compute -- the VM workloads (vm/benchmarks), run inside each app; time is the best of the app's own repetitions, higher ratio means Codename One is faster.

Workload Codename One Flutter Ratio
intArithmetic 522 ms wrong result Flutter: wrong result
longArithmetic 2893 ms did not run Flutter: did not run
mathTranscendental 266 ms did not run Flutter: did not run
arraySequential 135 ms 60 ms 0.44x
arrayRandom 717 ms wrong result Flutter: wrong result
objectAllocation 21 ms 16 ms 0.76x
valueEscape 85 ms 5 ms 0.06x
hashMapChurn 556 ms 162 ms 0.29x
stringBuilding 276 ms 67 ms 0.24x
recursion 286 ms 260 ms 0.91x
quicksortBench 284 ms wrong result Flutter: wrong result
Geometric mean 0.33x

Gate: within tolerance against scripts/flutter-bench/baseline; BEHIND FLUTTER on Compute (geomean of the VM workloads) (reported, not gated: a loss to Flutter on the web is currently accepted).

the JavaScript adapter needs a Chrome DevTools driver; sizes are reported and timings are not
This platform's adapter has not been exercised end to end before; treat the first published run as the thing under review.

linux

9 interleaved rounds; host load 0.82, 3.23, 2.83

Metric Codename One Flutter Ratio Winner
Installed size 113.5 MB 143.8 MB 1.27x Codename One
Executable code 15.8 MB 16.1 MB 1.02x Codename One
Download size (zipped) 81.7 MB 92.9 MB 1.14x Codename One
Cold start to first frame on screen 180 ms 226 ms 1.22x Codename One
Memory at rest 92.9 MB 225.4 MB 2.42x Codename One

Start-up and memory at rest are judged round by round: the ratio is the median of the per-round ratios, each from two launches made back to back, and the times and sizes shown are each side's median, so the ratio need not equal their quotient. Codename One was ahead in 8 of 9 rounds on cold start to first frame on screen; 9 of 9 rounds on memory at rest.

Compute -- the VM workloads (vm/benchmarks), run inside each app; time is the best of the app's own repetitions, higher ratio means Codename One is faster.

Workload Codename One Flutter Ratio
intArithmetic 74 ms 183 ms 2.47x
longArithmetic 56 ms 55 ms 0.98x
mathTranscendental 239 ms 271 ms 1.13x
arraySequential 15 ms 35 ms 2.33x
arrayRandom 287 ms 406 ms 1.42x
objectAllocation 24 ms 40 ms 1.67x
valueEscape 5 ms 7 ms 1.40x
hashMapChurn 45 ms 331 ms 7.36x
stringBuilding 39 ms 109 ms 2.79x
recursion 92 ms 256 ms 2.78x
quicksortBench 140 ms 149 ms 1.06x
Geometric mean 1.92x

Gate: within tolerance against scripts/flutter-bench/baseline.

This platform's adapter has not been exercised end to end before; treat the first published run as the thing under review.

macos

9 interleaved rounds; host load 5.06, 15.11, 17.72

Metric Codename One Flutter Ratio Winner
Installed size 124.7 MB 139.4 MB 1.12x Codename One
Executable code 33.6 MB 47.9 MB 1.43x Codename One
Download size (zipped) 85.6 MB 93.3 MB 1.09x Codename One
Cold start to first frame on screen 278 ms 406 ms 1.60x Codename One
Memory at rest 34.9 MB 51.8 MB 1.49x Codename One

Start-up and memory at rest are judged round by round: the ratio is the median of the per-round ratios, each from two launches made back to back, and the times and sizes shown are each side's median, so the ratio need not equal their quotient. Codename One was ahead in 9 of 9 rounds on cold start to first frame on screen; 9 of 9 rounds on memory at rest.

Compute -- the VM workloads (vm/benchmarks), run inside each app; time is the best of the app's own repetitions, higher ratio means Codename One is faster.

Workload Codename One Flutter Ratio
intArithmetic 112 ms 251 ms 2.24x
longArithmetic 69 ms 68 ms 0.99x
mathTranscendental 296 ms 322 ms 1.09x
arraySequential 11 ms 44 ms 4.00x
arrayRandom 266 ms 329 ms 1.24x
objectAllocation 28 ms 26 ms 0.93x
valueEscape 5 ms 13 ms 2.60x
hashMapChurn 37 ms 199 ms 5.38x
stringBuilding 25 ms 109 ms 4.36x
recursion 129 ms 259 ms 2.01x
quicksortBench 118 ms 145 ms 1.23x
Geometric mean 1.96x

Gate: within tolerance against scripts/flutter-bench/baseline.

This platform's adapter has not been exercised end to end before; treat the first published run as the thing under review.

windows

9 interleaved rounds

Metric Codename One Flutter Ratio Winner
Installed size 108.4 MB 121.1 MB 1.12x Codename One
Executable code 11.8 MB 14.1 MB 1.20x Codename One
Download size (zipped) 78.1 MB 86.4 MB 1.11x Codename One
Cold start to first frame on screen 126 ms 208 ms 1.62x Codename One
Memory at rest 57.2 MB 92.5 MB 1.62x Codename One

Start-up and memory at rest are judged round by round: the ratio is the median of the per-round ratios, each from two launches made back to back, and the times and sizes shown are each side's median, so the ratio need not equal their quotient. Codename One was ahead in 9 of 9 rounds on cold start to first frame on screen; 9 of 9 rounds on memory at rest.

Compute -- the VM workloads (vm/benchmarks), run inside each app; time is the best of the app's own repetitions, higher ratio means Codename One is faster.

Workload Codename One Flutter Ratio
intArithmetic 70 ms 161 ms 2.30x
longArithmetic 53 ms 50 ms 0.94x
mathTranscendental 161 ms 193 ms 1.20x
arraySequential 8 ms 30 ms 3.75x
arrayRandom 207 ms 238 ms 1.15x
objectAllocation 16 ms 26 ms 1.62x
valueEscape 0 ms 6 ms too fast to time
hashMapChurn 38 ms 257 ms 6.76x
stringBuilding 27 ms 89 ms 3.30x
recursion 141 ms 233 ms 1.65x
quicksortBench 123 ms 127 ms 1.03x
Geometric mean 1.92x

Gate: within tolerance against scripts/flutter-bench/baseline.

This platform's adapter has not been exercised end to end before; treat the first published run as the thing under review.

Codename One wins 26 of 26 measured metrics across 6 platform(s).

@shai-almog

shai-almog commented Oct 30, 2026 •

Copy link
Copy Markdown
Collaborator Author

Compared 195 screenshots: 195 matched.

Native Android coverage

  • 📊 Line coverage: 19.19% (56038/292047 lines covered) [HTML preview] (artifact android-coverage-report, jacocoAndroidReport/html/index.html)
    • Other counters: instruction 18.14% (269997/1488151), branch 12.40% (19632/158314), complexity 10.36% (15810/152567), method 15.72% (11379/72383), class 27.88% (2235/8017)
    • Lowest covered classes
      • kotlin.collections.unsigned.kotlin.collections.unsigned.UArraysKt___UArraysKt – 0.00% (0/2396 lines covered)
      • org.jacoco.agent.rt.internal_0e20598.asm.org.jacoco.agent.rt.internal_0e20598.asm.ClassReader – 0.00% (0/1524 lines covered)
      • androidx.compose.runtime.androidx.compose.runtime.LinkComposer – 0.00% (0/1430 lines covered)
      • org.jacoco.agent.rt.internal_0e20598.asm.org.jacoco.agent.rt.internal_0e20598.asm.MethodWriter – 0.00% (0/922 lines covered)
      • kotlinx.coroutines.channels.kotlinx.coroutines.channels.BufferedChannel – 0.00% (0/863 lines covered)
      • kotlin.sequences.kotlin.sequences.SequencesKt___SequencesKt – 0.00% (0/744 lines covered)
      • com.google.common.cache.com.google.common.cache.LocalCache$Segment – 0.00% (0/726 lines covered)
      • okio.okio.Buffer – 0.00% (0/687 lines covered)
      • kotlin.text.kotlin.text.StringsKt___StringsKt – 0.00% (0/630 lines covered)
      • com.codename1.androidcompat.rt.com.codename1.androidcompat.rt.TextXmlPullParser – 0.00% (0/623 lines covered)

✅ Native Android screenshot tests passed.

Native Android coverage

  • 📊 Line coverage: 19.19% (56038/292047 lines covered) [HTML preview] (artifact android-coverage-report, jacocoAndroidReport/html/index.html)
    • Other counters: instruction 18.14% (269997/1488151), branch 12.40% (19632/158314), complexity 10.36% (15810/152567), method 15.72% (11379/72383), class 27.88% (2235/8017)
    • Lowest covered classes
      • kotlin.collections.unsigned.kotlin.collections.unsigned.UArraysKt___UArraysKt – 0.00% (0/2396 lines covered)
      • org.jacoco.agent.rt.internal_0e20598.asm.org.jacoco.agent.rt.internal_0e20598.asm.ClassReader – 0.00% (0/1524 lines covered)
      • androidx.compose.runtime.androidx.compose.runtime.LinkComposer – 0.00% (0/1430 lines covered)
      • org.jacoco.agent.rt.internal_0e20598.asm.org.jacoco.agent.rt.internal_0e20598.asm.MethodWriter – 0.00% (0/922 lines covered)
      • kotlinx.coroutines.channels.kotlinx.coroutines.channels.BufferedChannel – 0.00% (0/863 lines covered)
      • kotlin.sequences.kotlin.sequences.SequencesKt___SequencesKt – 0.00% (0/744 lines covered)
      • com.google.common.cache.com.google.common.cache.LocalCache$Segment – 0.00% (0/726 lines covered)
      • okio.okio.Buffer – 0.00% (0/687 lines covered)
      • kotlin.text.kotlin.text.StringsKt___StringsKt – 0.00% (0/630 lines covered)
      • com.codename1.androidcompat.rt.com.codename1.androidcompat.rt.TextXmlPullParser – 0.00% (0/623 lines covered)

Benchmark Results

Detailed Performance Metrics

Metric Duration
SIMD kernel backend scalar fallback (no native SIMD)
SIMD int-add (64K x300) java 211ms / native 114ms = 1.8x speedup
SIMD float-mul (64K x300) java 199ms / native 135ms = 1.4x speedup
SIMD kernel correctness PASS (native result == scalar reference)
Base64 payload size 8192 bytes
Base64 benchmark iterations 6000
Base64 SIMD byte path gated to scalar (CPU autovectorizes scalar; explicit SIMD not beneficial here)
Base64 CN1 encode 91.000 ms
Base64 CN1 decode 83.000 ms
Base64 native encode 442.000 ms
Base64 encode ratio (CN1/native) 0.206x (79.4% faster)
Base64 native decode 273.000 ms
Base64 decode ratio (CN1/native) 0.304x (69.6% faster)
Image encode benchmark status skipped (SIMD unsupported)

@shai-almog

shai-almog commented Oct 31, 2026 •

Copy link
Copy Markdown
Collaborator Author

Compared 231 screenshots: 231 matched.
✅ JavaScript-port screenshot tests passed.

shai-almog and others added 5 commits October 31, 2026 12:18
# Conflicts:
#	scripts/initializr/common/src/main/resources/common.zip
A real-time thread that wakes while the collector scans its stack waits for
the scan, and the collector is an ordinary thread that the busy threads can
preempt inside that window. CI caught one 125ms stall of a 1kHz loop whose
cycle never ran past 4us. The collector now runs SCHED_FIFO just under the
held thread from raising its block to releasing it.

Co-Authored-By: Claude Opus 5.5 <noreply@anthropic.com>
cmd.exe finds a goto label by re-reading the batch file in 512-byte blocks,
and in an LF-only file it can miss a label that straddles a block boundary.
The device targets moved one onto a boundary and `build.bat javascript` ran
the android target on Windows. The archetype stores both launchers as CRLF,
as mvnw.cmd already is, the Initializr zip carries them that way, and the
telemetry injection matches its markers on LF and writes CRLF back.

Co-Authored-By: Claude Opus 5.5 <noreply@anthropic.com>
Both class examples used `...` for the parts they left out, and the RealtimeTask
one read I2C through a method that does not exist -- every I2C read returns a
new array, which a cycle must not do. The task example is now the guide's motor
loop, and the Realtime one passes a minimal task inline.

Co-Authored-By: Claude Opus 5.5 <noreply@anthropic.com>
@shai-almog

shai-almog commented Oct 31, 2026 •

Copy link
Copy Markdown
Collaborator Author

Compared 210 screenshots: 210 matched.
Native Windows port, REAL shipping pipeline: the hellocodenameone screenshot suite rendered by a binary CROSS-COMPILED on Linux (clang-cl + xwin, WebView2 linked) and RUN on a Windows x64 runner. Compared against the in-repo baseline in scripts/windows/screenshots.

Benchmark Results

Detailed Performance Metrics

Metric Duration
SIMD kernel backend SSE2 (x64) / NEON (arm64) native kernels
SIMD int-add (64K x300) java 44ms / native 3ms = 14.6x speedup
SIMD float-mul (64K x300) java 43ms / native 3ms = 14.3x speedup
SIMD kernel correctness PASS (native result == scalar reference)
Base64 native bridge unavailable (CN1 + SIMD + image benchmarks only)
Base64 payload size 8192 bytes
Base64 benchmark iterations 6000
Base64 SIMD byte path gated to scalar (CPU autovectorizes scalar; explicit SIMD not beneficial here)
Base64 CN1 encode 61.000 ms
Base64 CN1 decode 72.000 ms
Base64 SIMD encode 92.000 ms
Base64 encode ratio (SIMD/CN1) 1.508x (50.8% slower)
Base64 SIMD decode 81.000 ms
Base64 decode ratio (SIMD/CN1) 1.125x (12.5% slower)
Image encode benchmark iterations 100
Image createMask (SIMD off) 7.000 ms
Image createMask (SIMD on) 3.000 ms
Image createMask ratio (SIMD on/off) 0.429x (57.1% faster)
Image applyMask (SIMD off) 23.000 ms
Image applyMask (SIMD on) 23.000 ms
Image applyMask ratio (SIMD on/off) 1.000x (0.0% slower)
Image modifyAlpha (SIMD off) 26.000 ms
Image modifyAlpha (SIMD on) 17.000 ms
Image modifyAlpha ratio (SIMD on/off) 0.654x (34.6% faster)
Image modifyAlpha removeColor (SIMD off) 28.000 ms
Image modifyAlpha removeColor (SIMD on) 12.000 ms
Image modifyAlpha removeColor ratio (SIMD on/off) 0.429x (57.1% faster)

@shai-almog

shai-almog commented Oct 31, 2026 •

Copy link
Copy Markdown
Collaborator Author

Compared 210 screenshots: 210 matched.
Native Windows port (x64 / Intel-AMD): full hellocodenameone screenshot suite rendered offscreen with Direct2D/DirectWrite, plus the real benchmarks (base64 native/CN1/SIMD, image createMask/applyMask/modifyAlpha/PNG/JPEG, SSE2 SIMD kernels). Compared against the in-repo baseline in scripts/windows/screenshots.

Benchmark Results

Detailed Performance Metrics

Metric Duration
SIMD kernel backend SSE2 (x64) / NEON (arm64) native kernels
SIMD int-add (64K x300) java 57ms / native 6ms = 9.5x speedup
SIMD float-mul (64K x300) java 64ms / native 5ms = 12.8x speedup
SIMD kernel correctness PASS (native result == scalar reference)
Base64 native bridge unavailable (CN1 + SIMD + image benchmarks only)
Base64 payload size 8192 bytes
Base64 benchmark iterations 6000
Base64 SIMD byte path gated to scalar (CPU autovectorizes scalar; explicit SIMD not beneficial here)
Base64 CN1 encode 73.000 ms
Base64 CN1 decode 89.000 ms
Base64 SIMD encode 113.000 ms
Base64 encode ratio (SIMD/CN1) 1.548x (54.8% slower)
Base64 SIMD decode 104.000 ms
Base64 decode ratio (SIMD/CN1) 1.169x (16.9% slower)
Image encode benchmark iterations 100
Image createMask (SIMD off) 10.000 ms
Image createMask (SIMD on) 4.000 ms
Image createMask ratio (SIMD on/off) 0.400x (60.0% faster)
Image applyMask (SIMD off) 47.000 ms
Image applyMask (SIMD on) 58.000 ms
Image applyMask ratio (SIMD on/off) 1.234x (23.4% slower)
Image modifyAlpha (SIMD off) 59.000 ms
Image modifyAlpha (SIMD on) 32.000 ms
Image modifyAlpha ratio (SIMD on/off) 0.542x (45.8% faster)
Image modifyAlpha removeColor (SIMD off) 43.000 ms
Image modifyAlpha removeColor (SIMD on) 25.000 ms
Image modifyAlpha removeColor ratio (SIMD on/off) 0.581x (41.9% faster)

ParparVM vs HotSpot (JDK 25): Windows x64

Runner CPU: AMD64 Family 25 Model 1 Stepping 1, AuthenticAMD (baseline windows-x64@amd64-family-25-model-1-authenticamd)

Ratios are ParparVM / JDK 25: below 1.00x ParparVM is faster (time) or smaller (RAM). Median of 5 interleaved, paired rounds; every run's output was verified. A ratio more than 20% (time) / 25% (RAM) above its baseline in vm/selfhost/perf-baseline/ is a regression and fails; one that far below is an improvement, reported but not failed (a row whose calibration runs were noisier carries a wider tolerance), and for RAM the change must also exceed 0.05x in absolute terms. Both run unpinned on all of the runner's CPUs, with their own default thread counts.

Benchmark Cores Time RAM Status
hello (WinHelloMain) 4 1.41x (base 1.22x, +15.6%) 0.68x (base 0.58x, +16.6%) ok
translator (self) 4 0.73x (base 0.83x, -12.8%) 0.56x (base 0.54x, +3.4%) ok
intArithmetic 4 1.10x (base 1.10x, +0.0%) 0.06x (base 0.06x, +2.8%) ok
longArithmetic 4 1.14x (base 1.08x, +5.0%) 0.06x (base 0.05x, +3.4%) ok
mathTranscendental 4 0.78x (base 0.79x, -1.6%) 0.06x (base 0.06x, +2.9%) ok
arraySequential 4 1.44x (base 1.36x, +5.7%) 0.39x (base 0.39x, +0.2%) ok
arrayRandom 4 1.03x (base 1.06x, -2.7%) 0.23x (base 0.23x, +0.5%) ok
objectAllocation 4 1.60x (base 1.56x, +2.6%) 0.28x (base 0.39x, -27.2%) ok
valueEscape 4 0.10x (base 0.10x, +0.3%) 0.05x (base 0.04x, +4.3%) ok
hashMapChurn 4 1.89x (base 1.80x, +5.3%) 0.10x (base 0.09x, +3.7%) ok
stringBuilding 4 1.33x (base 1.22x, +9.2%) 0.32x (base 0.32x, -0.1%) ok
recursion 4 1.41x (base 1.49x, -5.7%) 0.06x (base 0.06x, +1.5%) ok
quicksort 4 1.11x (base 1.13x, -2.3%) 0.12x (base 0.12x, +0.8%) ok

Result: no regression

@shai-almog

shai-almog commented Nov 1, 2026 •

Copy link
Copy Markdown
Collaborator Author

Compared 196 screenshots: 196 matched.
✅ Native Mac screenshot tests passed.

Benchmark Results

  • VM Translation Time: 0 seconds
  • Compilation Time: 706 seconds

Detailed Performance Metrics

Metric Duration
SIMD kernel backend SSE2 (x64) / NEON (arm64) native kernels
SIMD int-add (64K x300) java 52ms / native 3ms = 17.3x speedup
SIMD float-mul (64K x300) java 52ms / native 3ms = 17.3x speedup
SIMD kernel correctness PASS (native result == scalar reference)
Base64 native bridge unavailable (CN1 + SIMD + image benchmarks only)
Base64 payload size 8192 bytes
Base64 benchmark iterations 6000
Base64 SIMD byte path active (NEON-accelerated)
Base64 CN1 encode 45.000 ms
Base64 CN1 decode 58.000 ms
Image encode benchmark iterations 100
Image createMask (SIMD off) 13.000 ms
Image createMask (SIMD on) 7.000 ms
Image createMask ratio (SIMD on/off) 0.538x (46.2% faster)
Image applyMask (SIMD off) 88.000 ms
Image applyMask (SIMD on) 76.000 ms
Image applyMask ratio (SIMD on/off) 0.864x (13.6% faster)
Image modifyAlpha (SIMD off) 66.000 ms
Image modifyAlpha (SIMD on) 63.000 ms
Image modifyAlpha ratio (SIMD on/off) 0.955x (4.5% faster)
Image modifyAlpha removeColor (SIMD off) 67.000 ms
Image modifyAlpha removeColor (SIMD on) 64.000 ms
Image modifyAlpha removeColor ratio (SIMD on/off) 0.955x (4.5% faster)

ParparVM vs HotSpot (JDK 25): macOS arm64

Runner CPU: Apple M1 (Virtual) (baseline macos-arm64)

Ratios are ParparVM / JDK 25: below 1.00x ParparVM is faster (time) or smaller (RAM). Median of 5 interleaved, paired rounds; every run's output was verified. A ratio more than 20% (time) / 25% (RAM) above its baseline in vm/selfhost/perf-baseline/ is a regression and fails; one that far below is an improvement, reported but not failed (a row whose calibration runs were noisier carries a wider tolerance), and for RAM the change must also exceed 0.05x in absolute terms. Both run unpinned on all of the runner's CPUs, with their own default thread counts.

Benchmark Cores Time RAM Status
hello (HelloCodenameOne) 3 0.84x (base 0.96x, -12.0%) 0.84x (base 0.93x, -9.7%) ok
translator (self) 3 0.70x (base 0.62x, +13.1%) 0.59x (base 0.78x, -24.8%) ok
intArithmetic 3 1.06x (base 1.03x, +3.0%) 0.12x (base 0.12x, +1.6%) ok
longArithmetic 3 1.04x (base 1.03x, +1.1%) 0.11x (base 0.07x, +61.9%) ok
mathTranscendental 3 0.98x (base 1.01x, -2.3%) 0.12x (base 0.12x, +1.3%) ok
arraySequential 3 0.44x (base 0.42x, +5.1%) 0.53x (base 0.53x, +0.2%) ok
arrayRandom 3 0.99x (base 0.99x, -0.2%) 0.32x (base 0.32x, +0.3%) ok
objectAllocation 3 1.01x (base 1.11x, -8.6%) 0.75x (base 0.72x, +3.9%) ok
valueEscape 3 0.51x (base 0.51x, +0.2%) 0.08x (base 0.09x, -6.7%) ok
hashMapChurn 3 1.08x (base 1.18x, -8.0%) 0.06x (base 0.07x, -3.0%) ok
stringBuilding 3 0.91x (base 0.84x, +7.7%) 0.40x (base 0.46x, -13.8%) ok
recursion 3 1.22x (base 1.24x, -0.9%) 0.12x (base 0.12x, -0.2%) ok
quicksort 3 1.01x (base 1.01x, -0.7%) 0.11x (base 0.11x, +1.2%) ok

Result: no regression

@shai-almog

shai-almog commented Nov 1, 2026 •

Copy link
Copy Markdown
Collaborator Author

Compared 210 screenshots: 210 matched.
Native Windows port (arm64 / Apple Silicon - Arm): full hellocodenameone screenshot suite rendered offscreen with Direct2D/DirectWrite, plus the real benchmarks (base64 native/CN1/SIMD, image createMask/applyMask/modifyAlpha/PNG/JPEG, NEON SIMD kernels). Compared against the in-repo baseline in scripts/windows/screenshots.

Benchmark Results

Detailed Performance Metrics

Metric Duration
SIMD kernel backend SSE2 (x64) / NEON (arm64) native kernels
SIMD int-add (64K x300) java 53ms / native 3ms = 17.6x speedup
SIMD float-mul (64K x300) java 53ms / native 2ms = 26.5x speedup
SIMD kernel correctness PASS (native result == scalar reference)
Base64 native bridge unavailable (CN1 + SIMD + image benchmarks only)
Base64 payload size 8192 bytes
Base64 benchmark iterations 6000
Base64 SIMD byte path gated to scalar (CPU autovectorizes scalar; explicit SIMD not beneficial here)
Base64 CN1 encode 60.000 ms
Base64 CN1 decode 70.000 ms
Base64 SIMD encode 77.000 ms
Base64 encode ratio (SIMD/CN1) 1.283x (28.3% slower)
Base64 SIMD decode 69.000 ms
Base64 decode ratio (SIMD/CN1) 0.986x (1.4% faster)
Image encode benchmark iterations 100
Image createMask (SIMD off) 5.000 ms
Image createMask (SIMD on) 2.000 ms
Image createMask ratio (SIMD on/off) 0.400x (60.0% faster)
Image applyMask (SIMD off) 17.000 ms
Image applyMask (SIMD on) 22.000 ms
Image applyMask ratio (SIMD on/off) 1.294x (29.4% slower)
Image modifyAlpha (SIMD off) 17.000 ms
Image modifyAlpha (SIMD on) 12.000 ms
Image modifyAlpha ratio (SIMD on/off) 0.706x (29.4% faster)
Image modifyAlpha removeColor (SIMD off) 16.000 ms
Image modifyAlpha removeColor (SIMD on) 9.000 ms
Image modifyAlpha removeColor ratio (SIMD on/off) 0.563x (43.8% faster)

ParparVM vs HotSpot (JDK 25): Windows arm64

Runner CPU: ARMv8 (64-bit) Family 8 Model D49 Revision 0, MICROSOFT CORPORATION (baseline windows-arm64@armv8-64-bit-family-8-model-d49-microsoft-corporation)

Ratios are ParparVM / JDK 25: below 1.00x ParparVM is faster (time) or smaller (RAM). Median of 5 interleaved, paired rounds; every run's output was verified. A ratio more than 20% (time) / 25% (RAM) above its baseline in vm/selfhost/perf-baseline/ is a regression and fails; one that far below is an improvement, reported but not failed (a row whose calibration runs were noisier carries a wider tolerance), and for RAM the change must also exceed 0.05x in absolute terms. Both run unpinned on all of the runner's CPUs, with their own default thread counts.

Benchmark Cores Time RAM Status
hello (WinHelloMain) 4 1.05x (base 1.11x, -5.3%) 0.71x (base 0.75x, -5.3%) ok
translator (self) 4 0.88x (base 0.84x, +4.8%) 0.48x (base 0.51x, -5.2%) ok
intArithmetic 4 1.04x (base 1.04x, -0.0%) 0.06x (base 0.06x, +3.5%) ok
longArithmetic 4 0.80x (base 0.80x, +0.0%) 0.06x (base 0.06x, +3.7%) ok
mathTranscendental 4 0.70x (base 0.72x, -3.1%) 0.07x (base 0.06x, +2.1%) ok
arraySequential 4 0.39x (base 0.46x, -14.4%) 0.39x (base 0.39x, -0.0%) ok
arrayRandom 4 0.94x (base 0.94x, +0.7%) 0.23x (base 0.23x, +0.3%) ok
objectAllocation 4 1.82x (base 1.82x, +0.2%) 0.40x (base 0.43x, -6.0%) ok
valueEscape 4 0.76x (base 0.76x, +0.0%) 0.05x (base 0.05x, +3.7%) ok
hashMapChurn 4 0.98x (base 0.98x, -0.6%) 0.12x (base 0.12x, -0.2%) ok
stringBuilding 4 1.54x (base 1.43x, +8.0%) 0.27x (base 0.27x, -0.2%) ok
recursion 4 1.46x (base 1.46x, -0.4%) 0.07x (base 0.07x, +1.4%) ok
quicksort 4 1.01x (base 1.00x, +0.7%) 0.12x (base 0.12x, +0.9%) ok

Result: no regression

@shai-almog

shai-almog commented Nov 1, 2026 •

Copy link
Copy Markdown
Collaborator Author

Compared 210 screenshots: 210 matched.
Native Linux port (x64), GTK3/Cairo/Pango, ParparVM bytecode-to-C (no JVM): the hellocodenameone screenshot suite rendered by a native ELF built + run on the GitHub x64 runner. Baseline: scripts/linux/screenshots.

ParparVM vs HotSpot (JDK 25): Linux x64

Runner CPU: AMD EPYC 7763 64-Core Processor (baseline linux-x64@amd-epyc-7763-64-core-processor)

Ratios are ParparVM / JDK 25: below 1.00x ParparVM is faster (time) or smaller (RAM). Median of 5 interleaved, paired rounds; every run's output was verified. A ratio more than 20% (time) / 25% (RAM) above its baseline in vm/selfhost/perf-baseline/ is a regression and fails; one that far below is an improvement, reported but not failed (a row whose calibration runs were noisier carries a wider tolerance), and for RAM the change must also exceed 0.05x in absolute terms. Both run unpinned on all of the runner's CPUs, with their own default thread counts.

Benchmark Cores Time RAM Status
hello (LinuxHelloMain) 4 0.94x (base 0.85x, +10.8%) 0.75x (base 0.83x, -9.8%) ok
translator (self) 4 0.53x (base 0.64x, -16.8%) 0.47x (base 0.52x, -10.0%) ok
intArithmetic 4 1.10x (base 1.12x, -1.2%) 0.04x (base 0.06x, -28.8%) ok
longArithmetic 4 1.08x (base 1.08x, +0.0%) 0.04x (base 0.05x, -28.2%) ok
mathTranscendental 4 1.08x (base 1.08x, -0.1%) 0.04x (base 0.07x, -44.8%) ok
arraySequential 4 2.11x (base 2.00x, +5.1%) 0.36x (base 0.36x, +0.4%) ok
arrayRandom 4 1.19x (base 0.91x, +30.7%) 0.20x (base 0.21x, -3.5%) ok
objectAllocation 4 1.56x (base 1.65x, -5.3%) 0.30x (base 0.35x, -14.0%) ok
valueEscape 4 0.10x (base 0.10x, -0.4%) 0.03x (base 0.04x, -26.1%) ok
hashMapChurn 4 1.51x (base 1.48x, +1.7%) 0.10x (base 0.09x, +9.8%) ok
stringBuilding 4 1.30x (base 1.39x, -6.5%) 0.31x (base 0.31x, +0.0%) ok
recursion 4 1.39x (base 1.25x, +10.5%) 0.04x (base 0.08x, -46.9%) ok
quicksort 4 1.09x (base 1.07x, +1.4%) 0.10x (base 0.11x, -12.8%) ok

Result: no regression

@shai-almog

shai-almog commented Nov 1, 2026 •

Copy link
Copy Markdown
Collaborator Author

Compared 210 screenshots: 210 matched.
Native Linux port (arm64), GTK3/Cairo/Pango, ParparVM bytecode-to-C (no JVM): the hellocodenameone screenshot suite rendered by a native ELF built + run on the GitHub arm64 runner. Baseline: scripts/linux/screenshots-arm.

ParparVM vs HotSpot (JDK 25): Linux arm64

Runner CPU: Neoverse-N2 (baseline linux-arm64@neoverse-n2)

Ratios are ParparVM / JDK 25: below 1.00x ParparVM is faster (time) or smaller (RAM). Median of 5 interleaved, paired rounds; every run's output was verified. A ratio more than 20% (time) / 25% (RAM) above its baseline in vm/selfhost/perf-baseline/ is a regression and fails; one that far below is an improvement, reported but not failed (a row whose calibration runs were noisier carries a wider tolerance), and for RAM the change must also exceed 0.05x in absolute terms. Both run unpinned on all of the runner's CPUs, with their own default thread counts.

Benchmark Cores Time RAM Status
hello (LinuxHelloMain) 4 0.93x (base 1.02x, -8.5%) 0.74x (base 0.66x, +12.6%) ok
translator (self) 4 0.74x (base 0.70x, +6.4%) 0.42x (base 0.43x, -3.3%) ok
intArithmetic 4 1.04x (base 1.04x, -0.0%) 0.03x (base 0.03x, +4.6%) ok
longArithmetic 4 0.79x (base 0.79x, -0.1%) 0.03x (base 0.03x, +4.8%) ok
mathTranscendental 4 1.09x (base 1.10x, -0.3%) 0.04x (base 0.03x, +9.7%) ok
arraySequential 4 0.38x (base 0.36x, +4.4%) 0.37x (base 0.37x, +0.2%) ok
arrayRandom 4 0.94x (base 0.94x, +0.0%) 0.20x (base 0.20x, +0.6%) ok
objectAllocation 4 2.03x (base 1.77x, +14.6%) 0.36x (base 0.37x, -3.3%) ok
valueEscape 4 0.51x (base 0.51x, -0.1%) 0.03x (base 0.03x, +6.0%) ok
hashMapChurn 4 0.86x (base 0.84x, +2.3%) 0.13x (base 0.12x, +6.9%) ok
stringBuilding 4 1.37x (base 1.57x, -12.4%) 0.26x (base 0.26x, -0.1%) ok
recursion 4 1.42x (base 1.43x, -0.7%) 0.04x (base 0.04x, +2.9%) ok
quicksort 4 1.01x (base 0.99x, +1.3%) 0.09x (base 0.09x, +1.2%) ok

Result: no regression

@shai-almog

shai-almog commented Nov 1, 2026 •

Copy link
Copy Markdown
Collaborator Author

Apple TV (tvOS / Metal)

Compared 188 screenshots: 171 matched, 13 updated, 4 missing references.

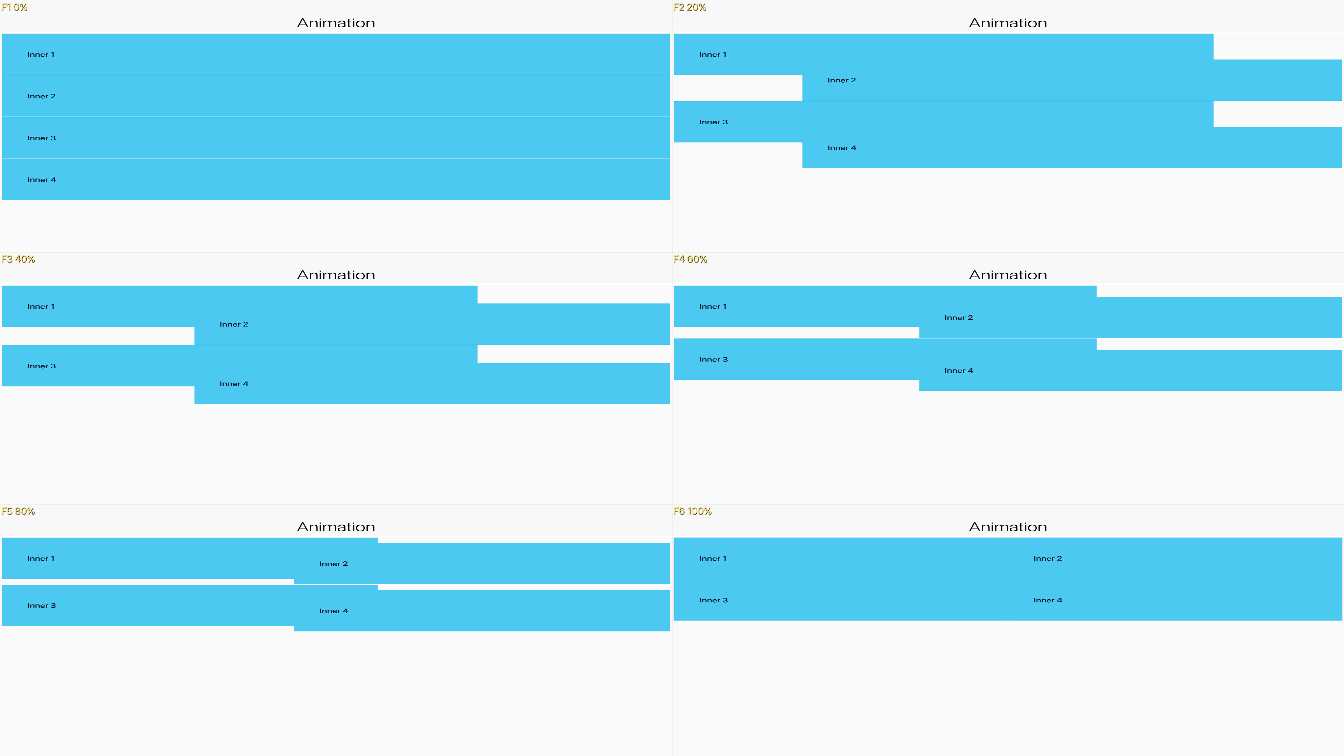
  • AnimateHierarchyScreenshotTest — updated screenshot. Screenshot differs (3840x2160 px, bit depth 8).

    AnimateHierarchyScreenshotTest
    Preview info: JPEG preview quality 50; JPEG preview quality 50; downscaled to 1344x756.
    Full-resolution PNG saved as AnimateHierarchyScreenshotTest.png in workflow artifacts.

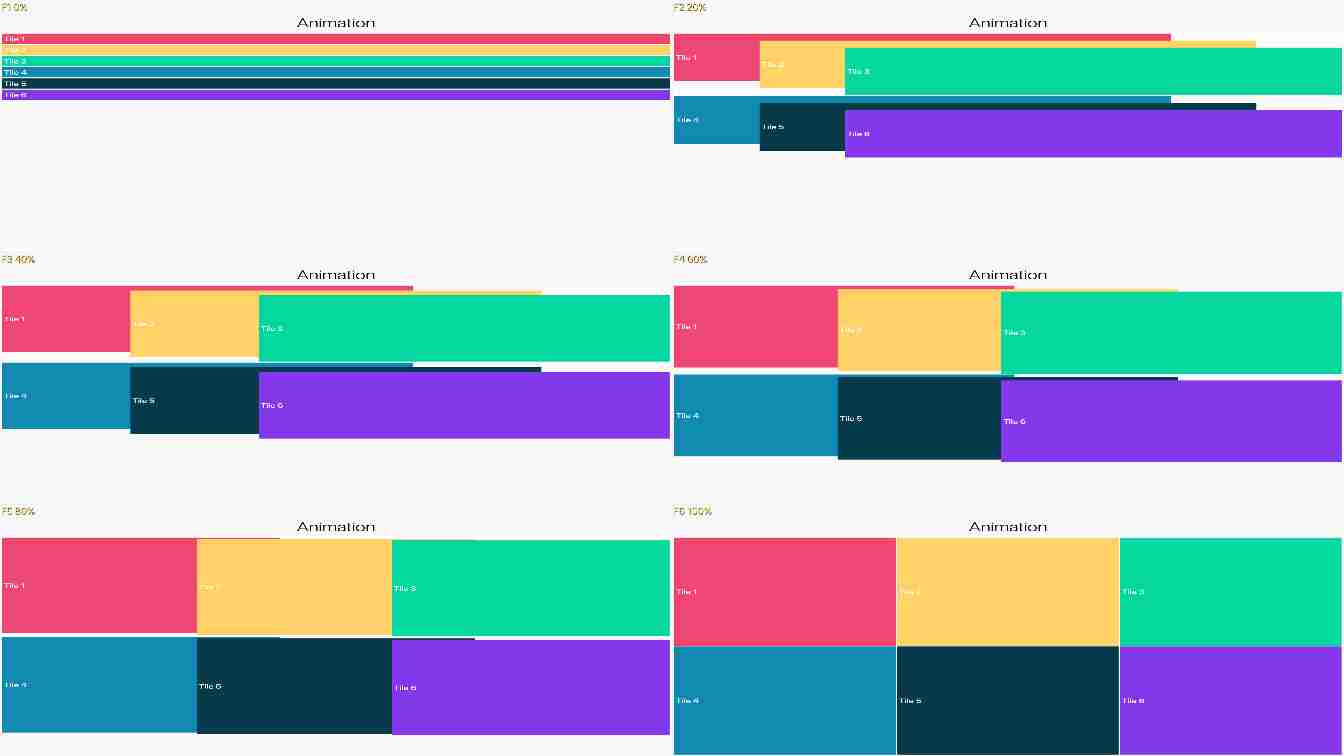
  • AnimateLayoutScreenshotTest — updated screenshot. Screenshot differs (3840x2160 px, bit depth 8).

    AnimateLayoutScreenshotTest
    Preview info: JPEG preview quality 20; JPEG preview quality 20; downscaled to 1344x756.
    Full-resolution PNG saved as AnimateLayoutScreenshotTest.png in workflow artifacts.

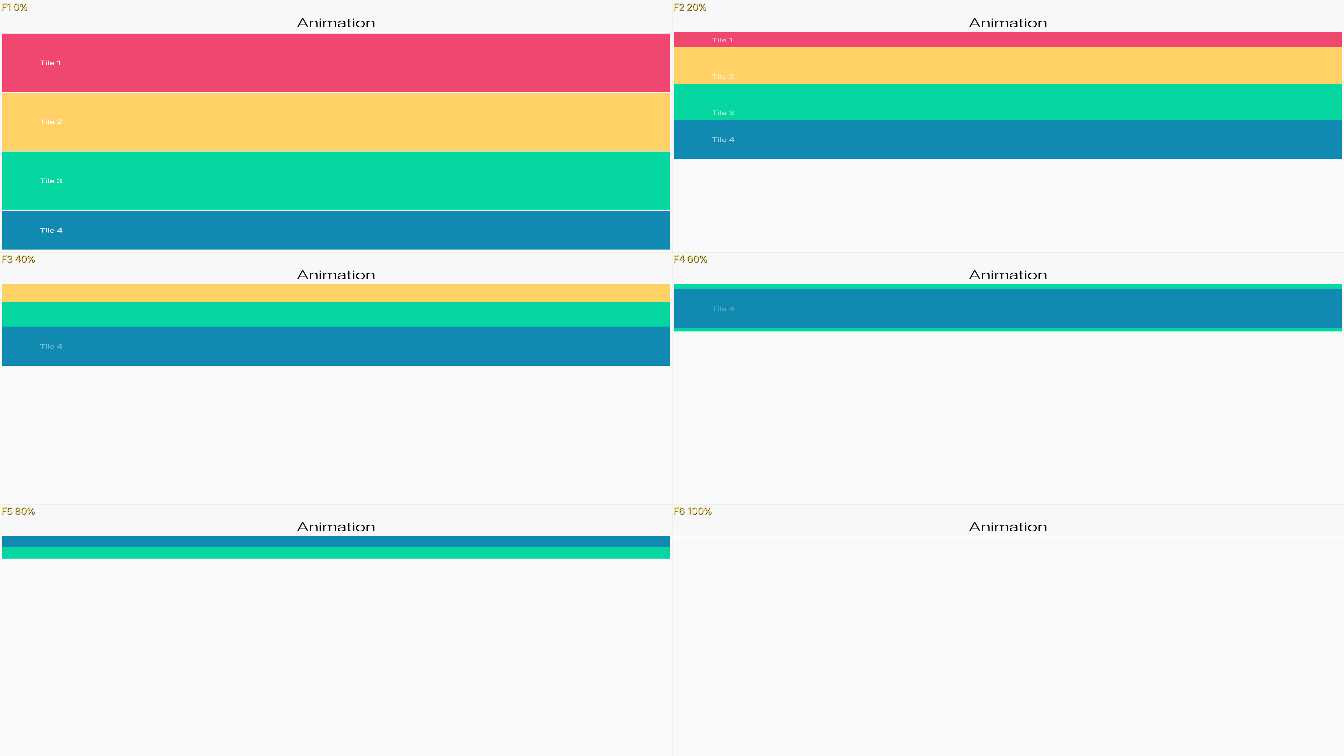
  • AnimateUnlayoutScreenshotTest — updated screenshot. Screenshot differs (3840x2160 px, bit depth 8).

    AnimateUnlayoutScreenshotTest
    Preview info: JPEG preview quality 50; JPEG preview quality 50; downscaled to 1344x756.
    Full-resolution PNG saved as AnimateUnlayoutScreenshotTest.png in workflow artifacts.

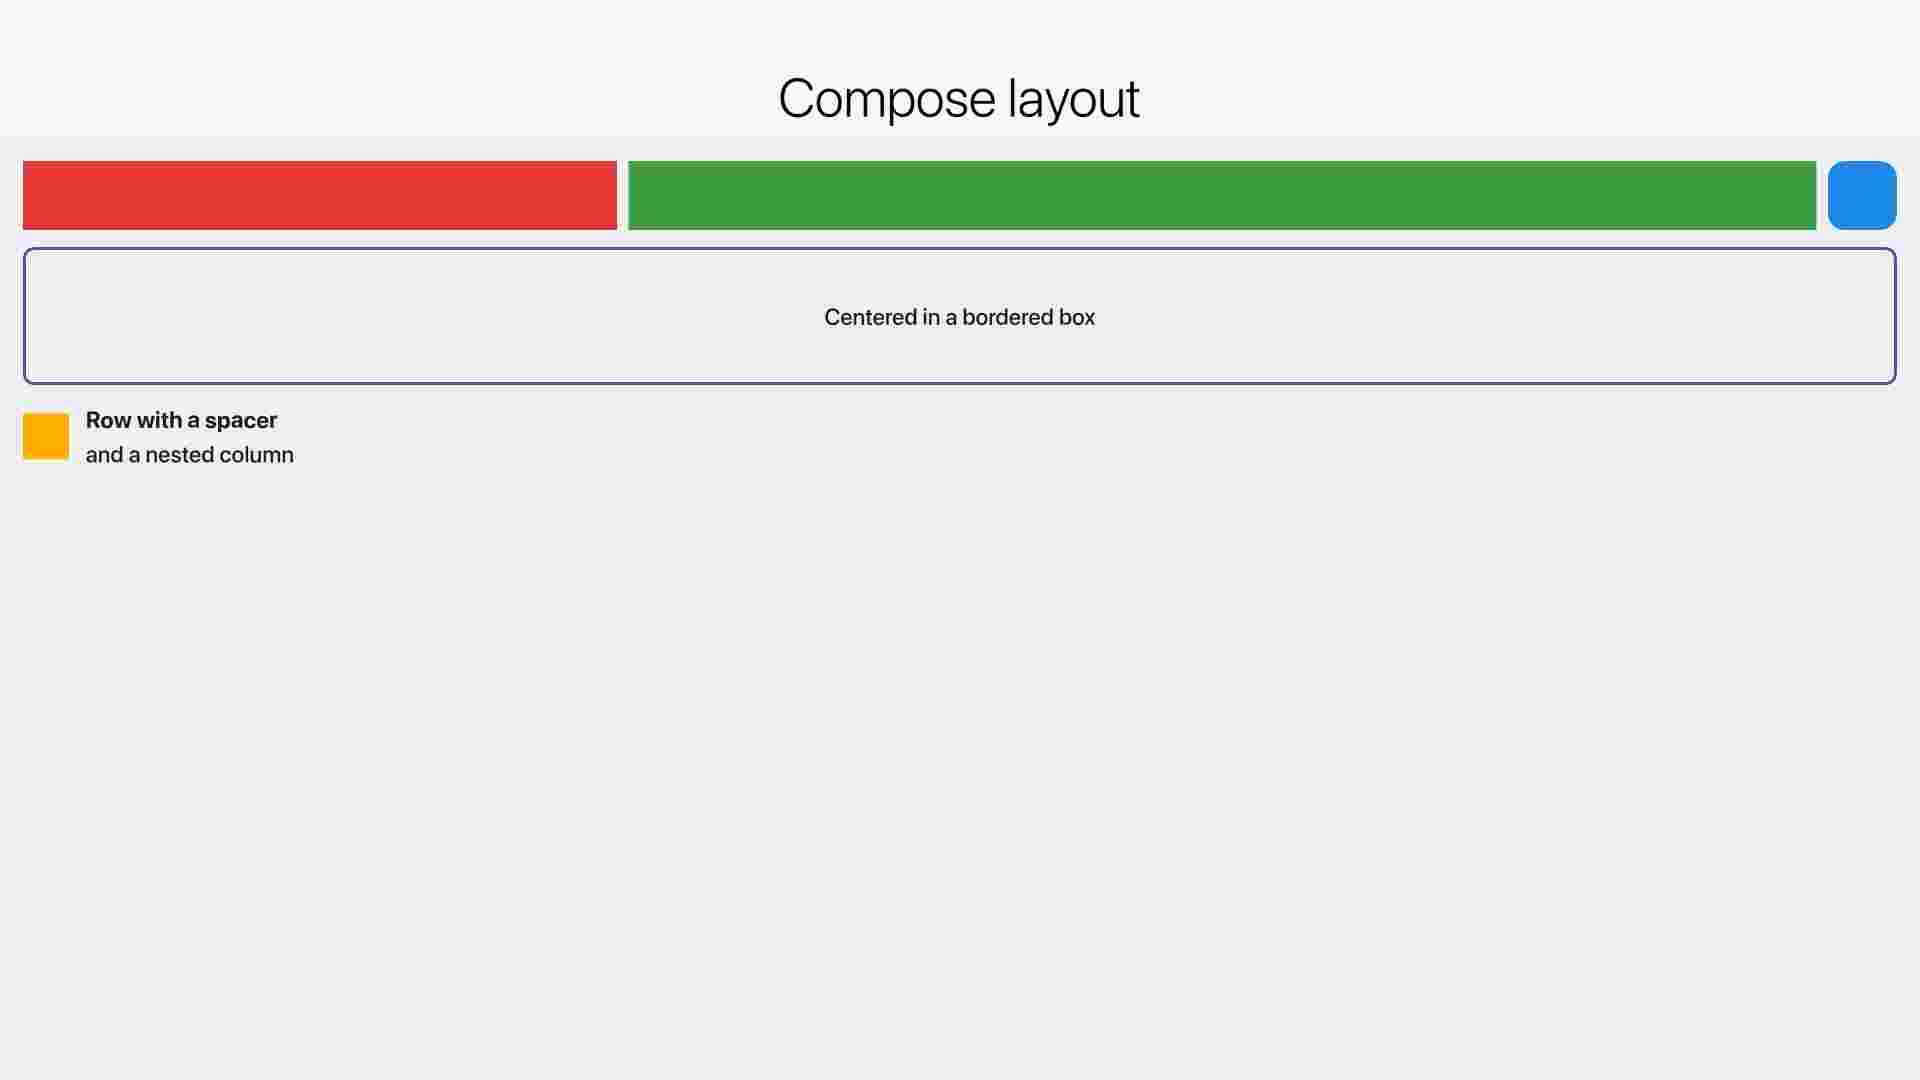
  • KmpCompatLayout — missing reference. Reference screenshot missing at /Users/runner/work/CodenameOne/CodenameOne/scripts/ios/screenshots-tv/KmpCompatLayout.png.

    KmpCompatLayout
    Preview info: JPEG preview quality 10; JPEG preview quality 10; downscaled to 1920x1080.
    Full-resolution PNG saved as KmpCompatLayout.png in workflow artifacts.

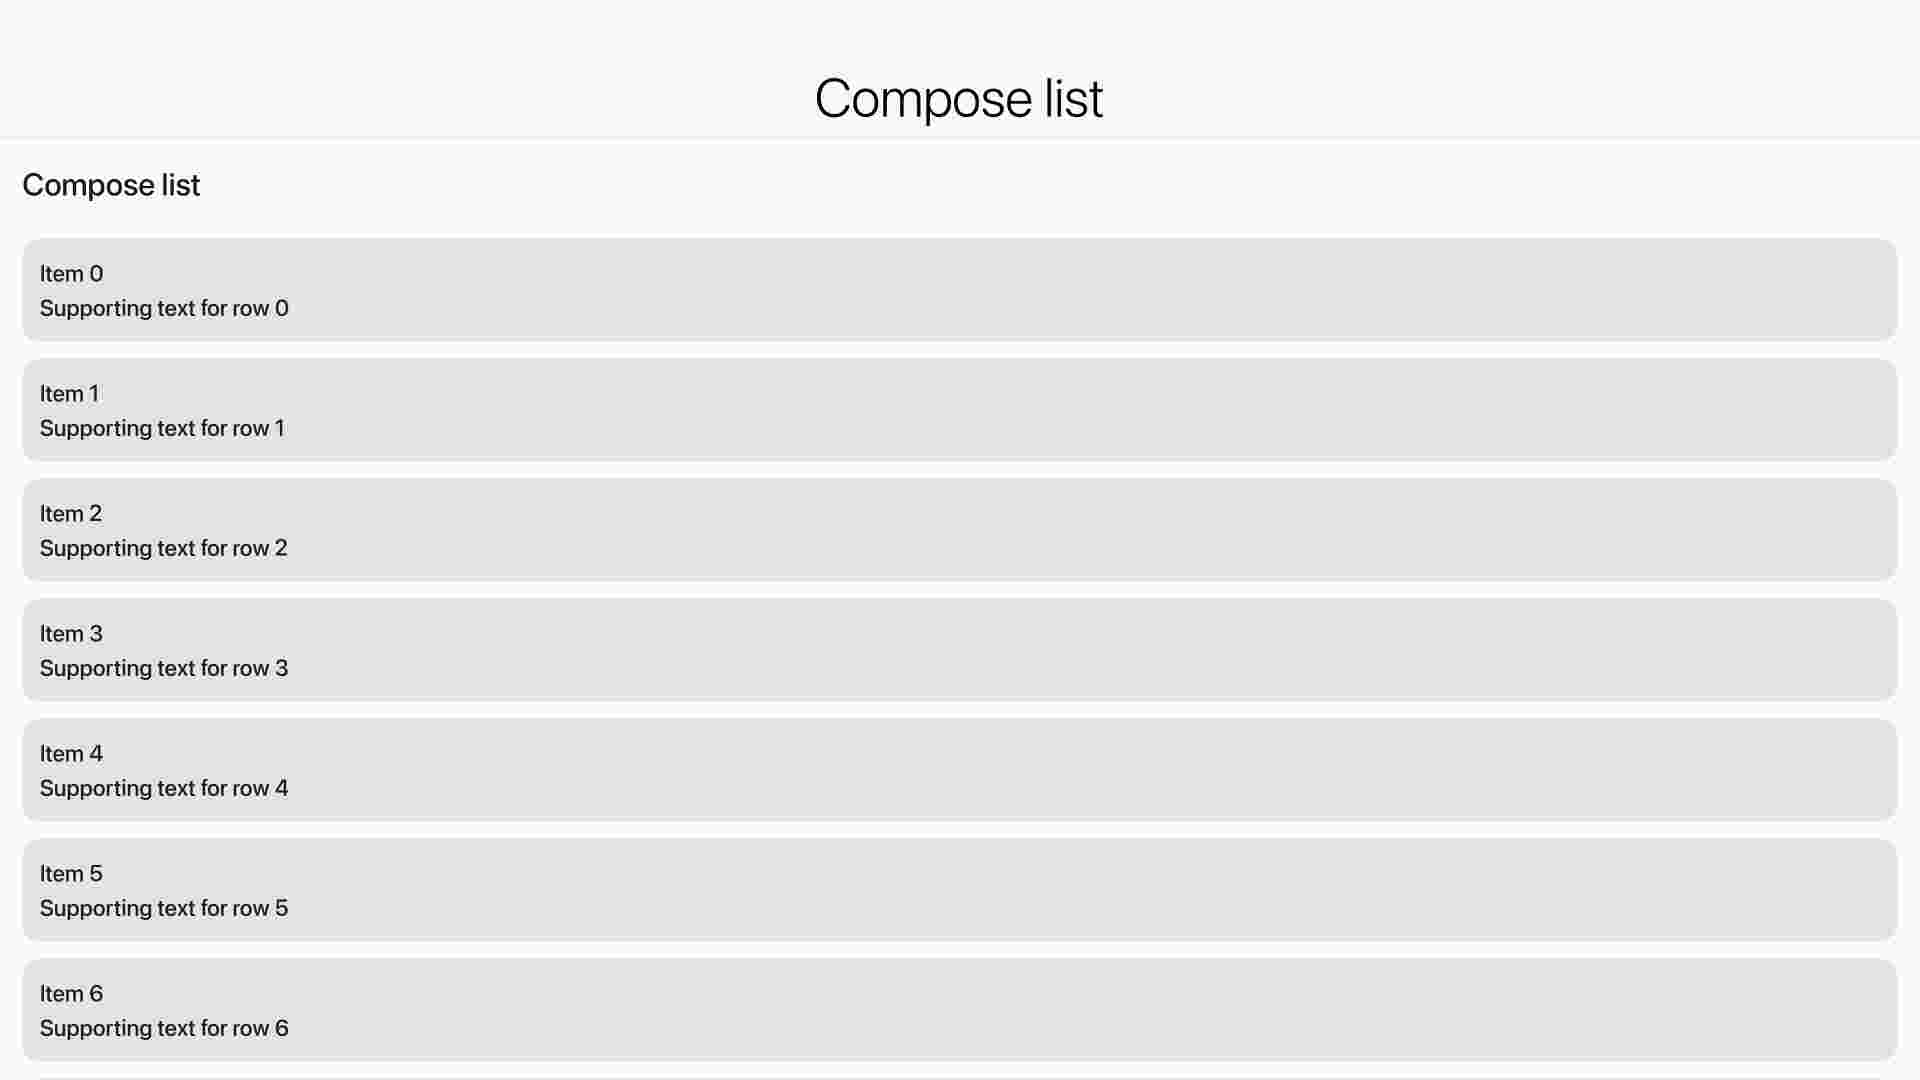
  • KmpCompatList — missing reference. Reference screenshot missing at /Users/runner/work/CodenameOne/CodenameOne/scripts/ios/screenshots-tv/KmpCompatList.png.

    KmpCompatList
    Preview info: JPEG preview quality 10; JPEG preview quality 10; downscaled to 1920x1080.
    Full-resolution PNG saved as KmpCompatList.png in workflow artifacts.

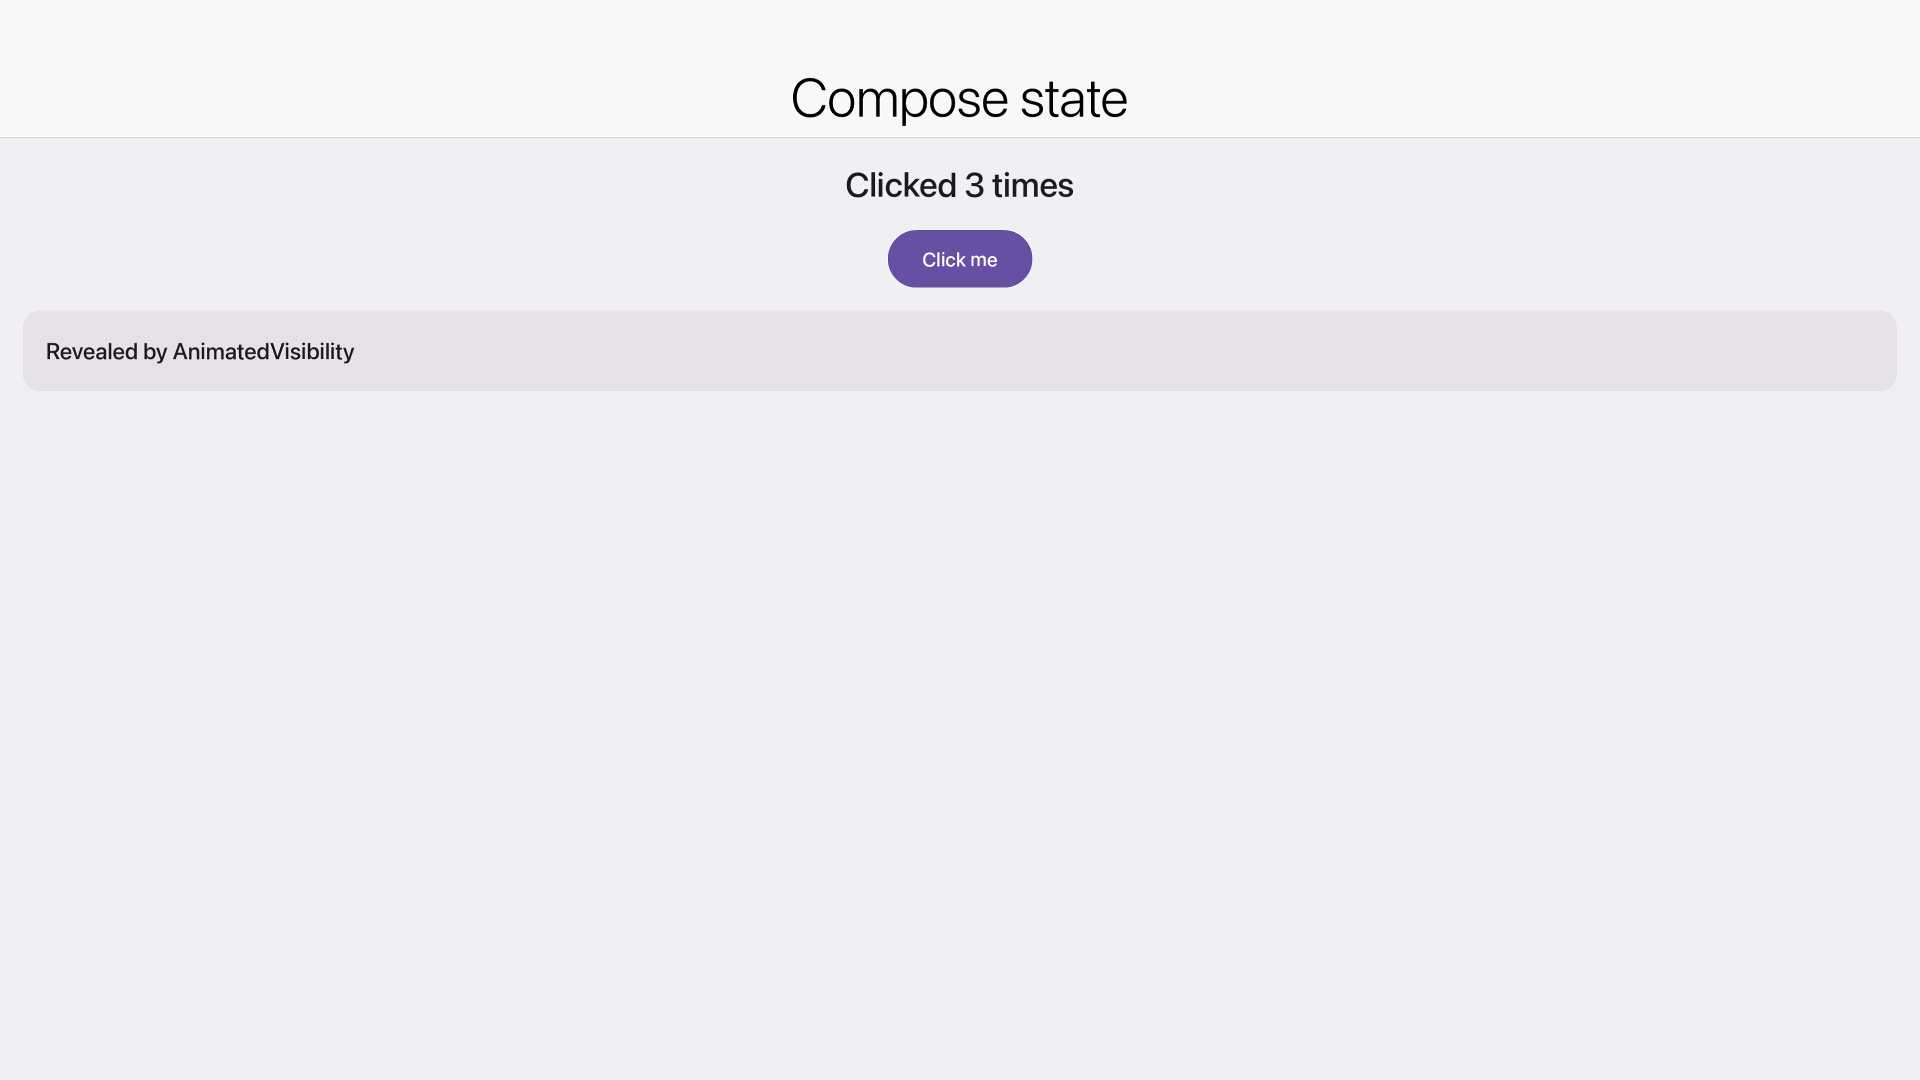
  • KmpCompatState — missing reference. Reference screenshot missing at /Users/runner/work/CodenameOne/CodenameOne/scripts/ios/screenshots-tv/KmpCompatState.png.

    KmpCompatState
    Preview info: JPEG preview quality 50; JPEG preview quality 50; downscaled to 1920x1080.
    Full-resolution PNG saved as KmpCompatState.png in workflow artifacts.

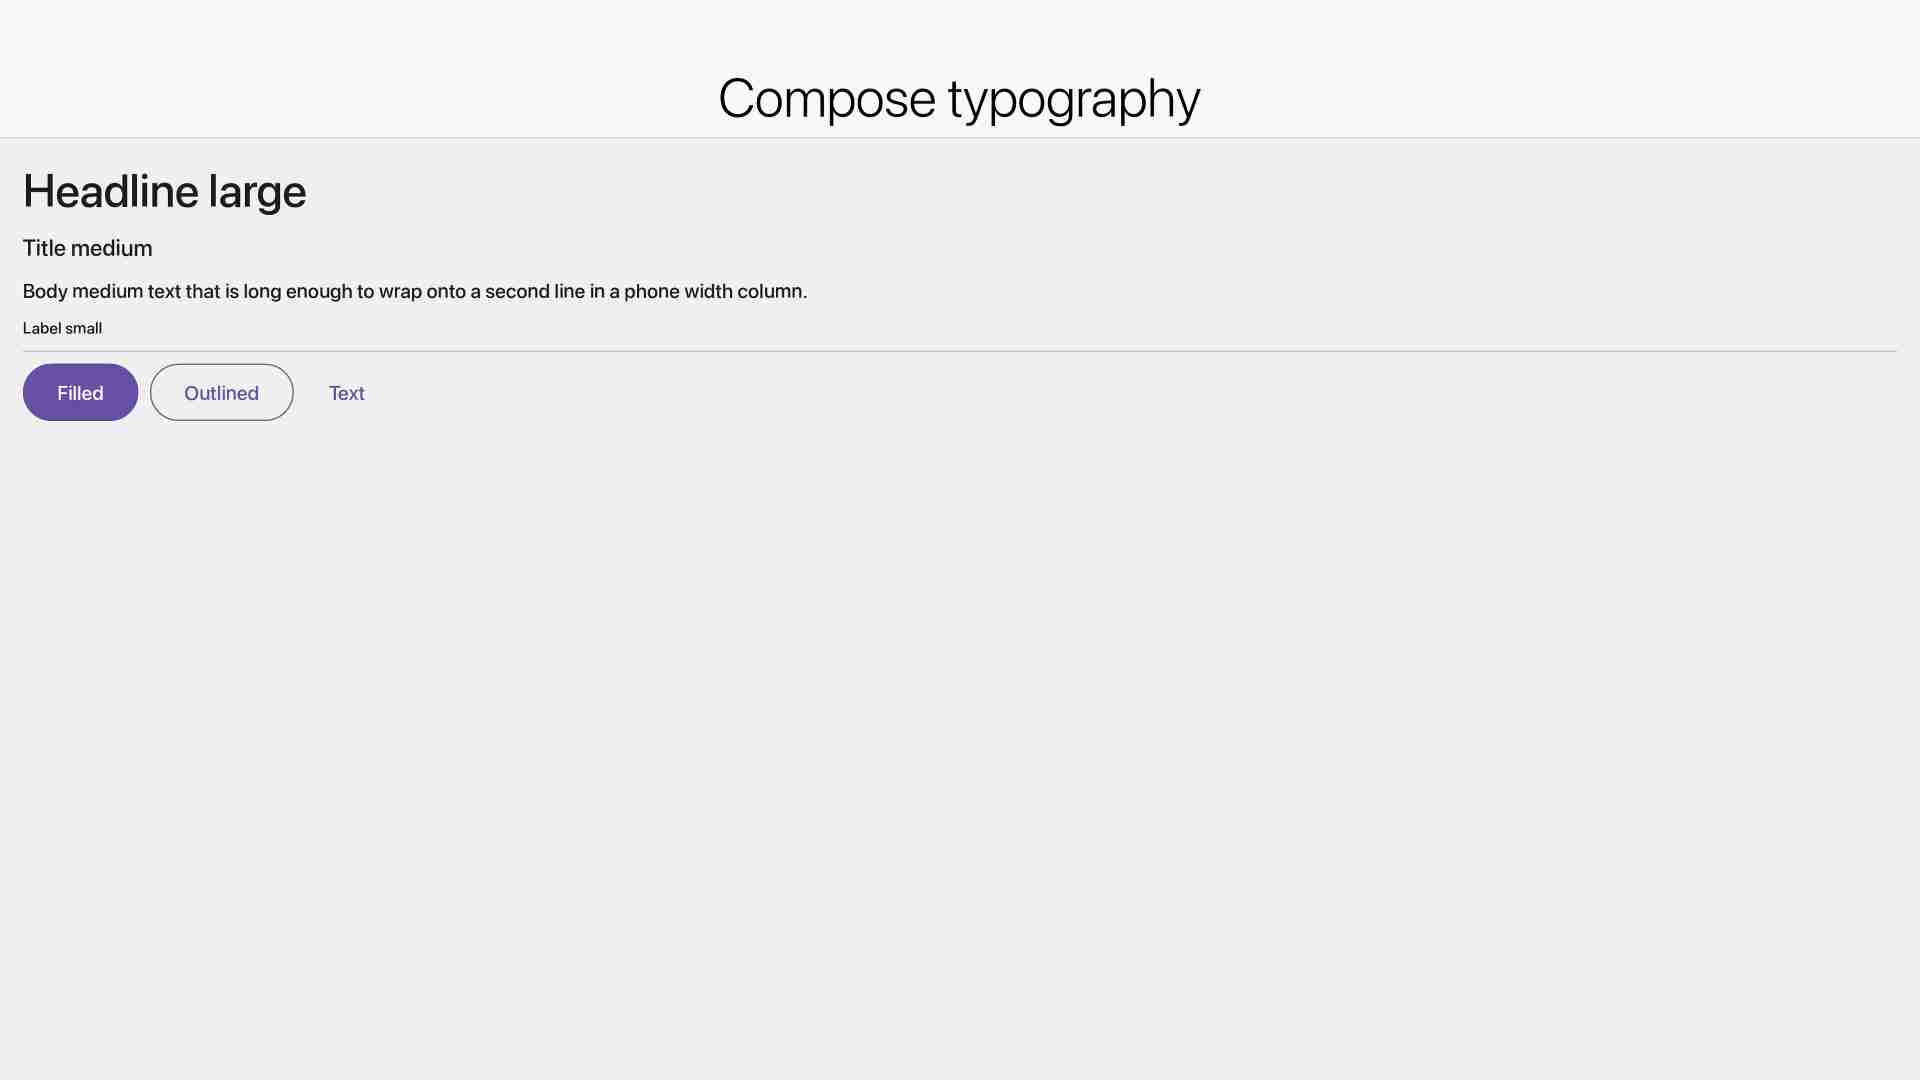
  • KmpCompatTypography — missing reference. Reference screenshot missing at /Users/runner/work/CodenameOne/CodenameOne/scripts/ios/screenshots-tv/KmpCompatTypography.png.

    KmpCompatTypography
    Preview info: JPEG preview quality 20; JPEG preview quality 20; downscaled to 1920x1080.
    Full-resolution PNG saved as KmpCompatTypography.png in workflow artifacts.

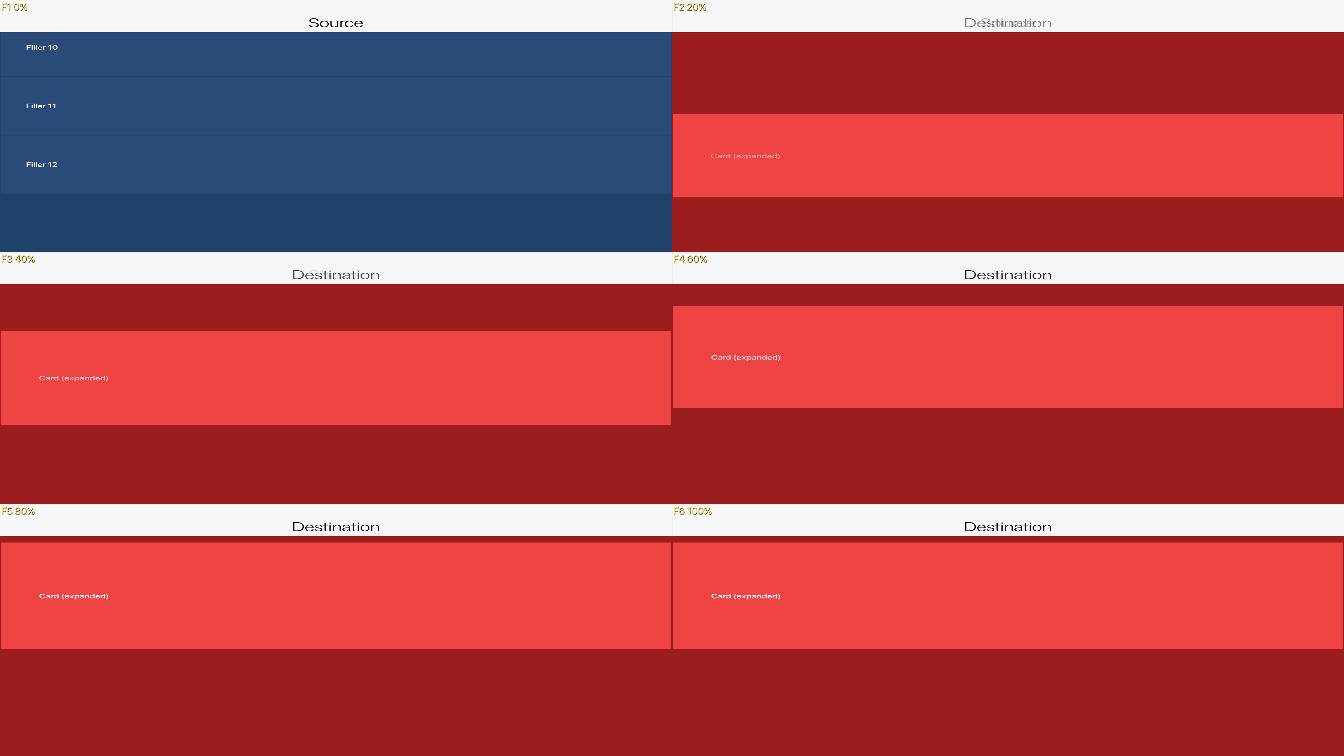
  • MorphTransitionScrolledSourceTest — updated screenshot. Screenshot differs (3840x2160 px, bit depth 8).

    MorphTransitionScrolledSourceTest
    Preview info: JPEG preview quality 70; JPEG preview quality 70; downscaled to 1344x756.
    Full-resolution PNG saved as MorphTransitionScrolledSourceTest.png in workflow artifacts.

  • PullToRefreshSpinnerScreenshotTest — updated screenshot. Screenshot differs (3840x2160 px, bit depth 8).

    PullToRefreshSpinnerScreenshotTest
    Preview info: JPEG preview quality 10; JPEG preview quality 10; downscaled to 1920x1080.
    Full-resolution PNG saved as PullToRefreshSpinnerScreenshotTest.png in workflow artifacts.

  • SheetSlideUpAnimationScreenshotTest — updated screenshot. Screenshot differs (3840x2160 px, bit depth 8).

    SheetSlideUpAnimationScreenshotTest
    Preview info: JPEG preview quality 10; JPEG preview quality 10; downscaled to 1920x1080.
    Full-resolution PNG saved as SheetSlideUpAnimationScreenshotTest.png in workflow artifacts.

  • SmoothScrollScreenshotTest — updated screenshot. Screenshot differs (3840x2160 px, bit depth 8).

    SmoothScrollScreenshotTest
    Preview info: JPEG preview quality 20; JPEG preview quality 20; downscaled to 1344x756.
    Full-resolution PNG saved as SmoothScrollScreenshotTest.png in workflow artifacts.

  • StatusBarTapDiagnosticScreenshotTest — updated screenshot. Screenshot differs (3840x2160 px, bit depth 8).

    StatusBarTapDiagnosticScreenshotTest
    Preview info: JPEG preview quality 60; JPEG preview quality 60; downscaled to 1344x756.
    Full-resolution PNG saved as StatusBarTapDiagnosticScreenshotTest.png in workflow artifacts.

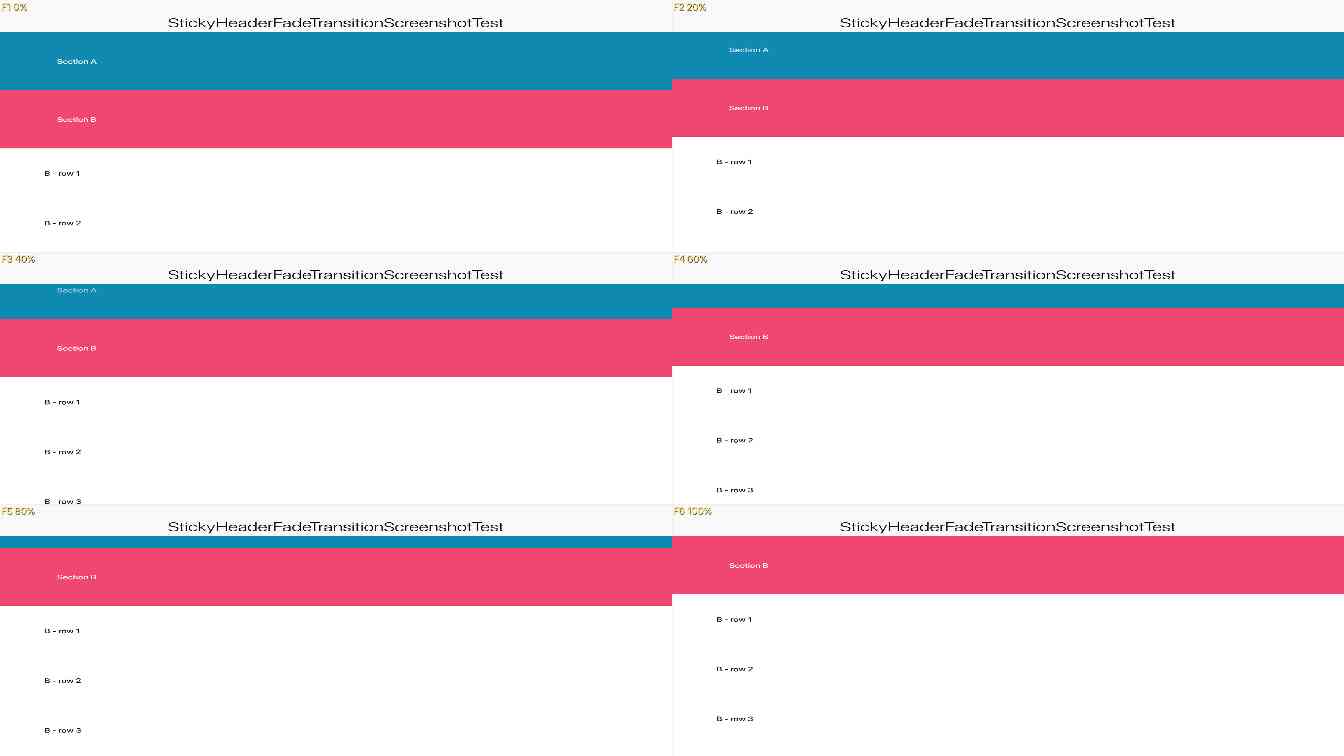
  • StickyHeaderFadeTransitionScreenshotTest — updated screenshot. Screenshot differs (3840x2160 px, bit depth 8).

    StickyHeaderFadeTransitionScreenshotTest
    Preview info: JPEG preview quality 30; JPEG preview quality 30; downscaled to 1344x756.
    Full-resolution PNG saved as StickyHeaderFadeTransitionScreenshotTest.png in workflow artifacts.

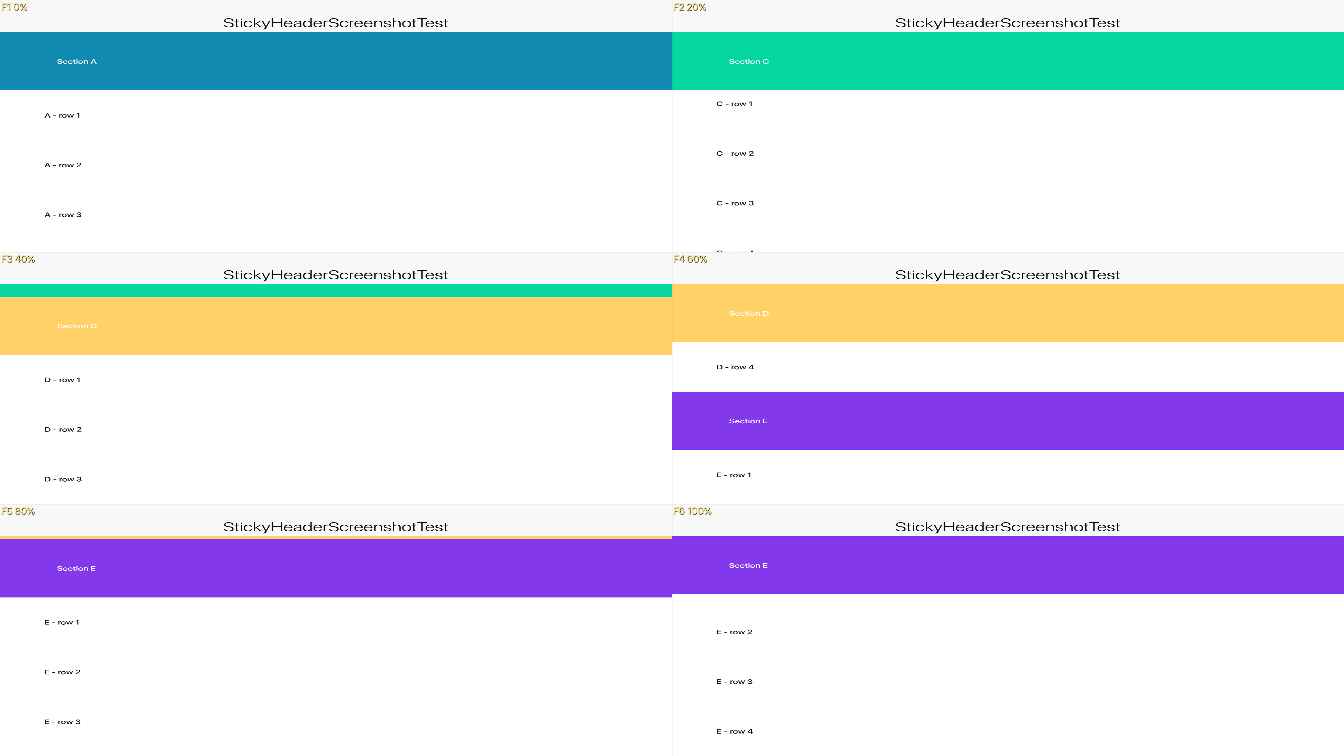
  • StickyHeaderScreenshotTest — updated screenshot. Screenshot differs (3840x2160 px, bit depth 8).

    StickyHeaderScreenshotTest
    Preview info: JPEG preview quality 40; JPEG preview quality 40; downscaled to 1344x756.
    Full-resolution PNG saved as StickyHeaderScreenshotTest.png in workflow artifacts.

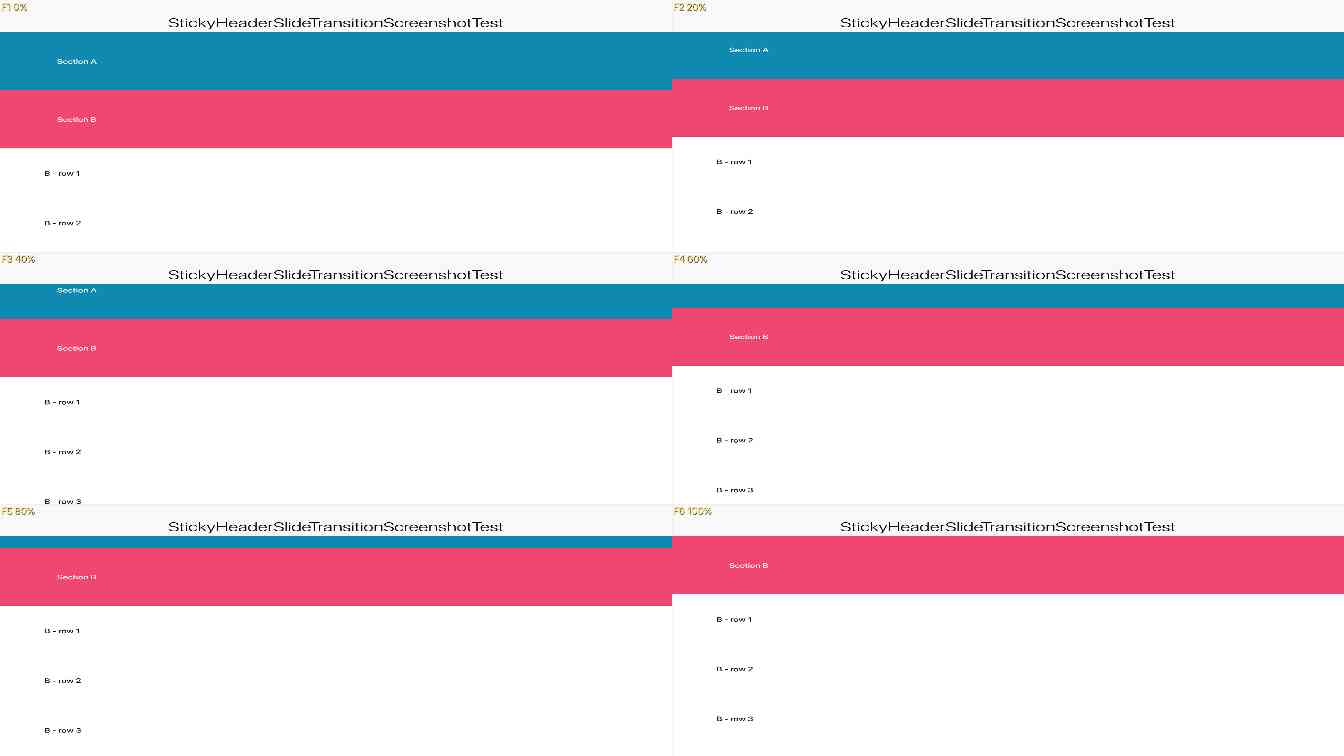
  • StickyHeaderSlideTransitionScreenshotTest — updated screenshot. Screenshot differs (3840x2160 px, bit depth 8).

    StickyHeaderSlideTransitionScreenshotTest
    Preview info: JPEG preview quality 30; JPEG preview quality 30; downscaled to 1344x756.
    Full-resolution PNG saved as StickyHeaderSlideTransitionScreenshotTest.png in workflow artifacts.

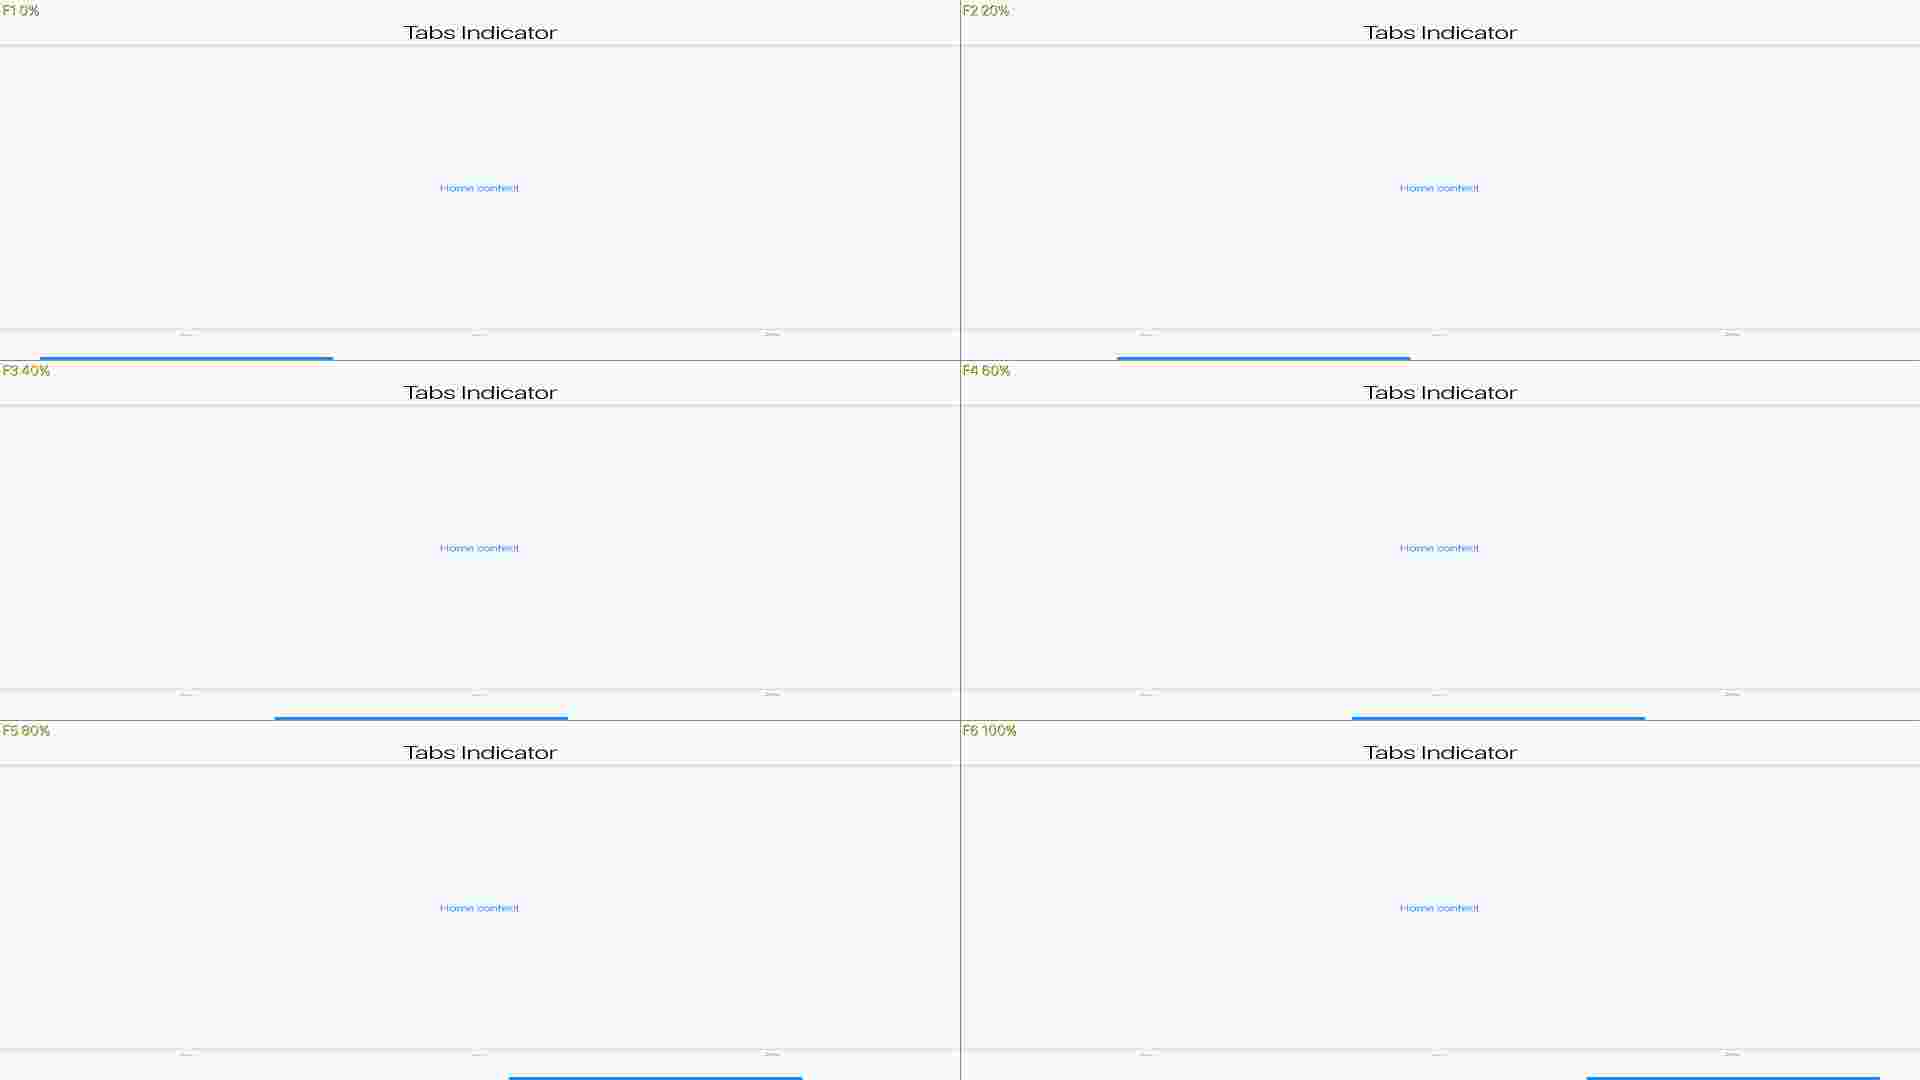
  • TabsAnimatedIndicatorScreenshotTest — updated screenshot. Screenshot differs (3840x2160 px, bit depth 8).

    TabsAnimatedIndicatorScreenshotTest
    Preview info: JPEG preview quality 10; JPEG preview quality 10; downscaled to 1920x1080.
    Full-resolution PNG saved as TabsAnimatedIndicatorScreenshotTest.png in workflow artifacts.

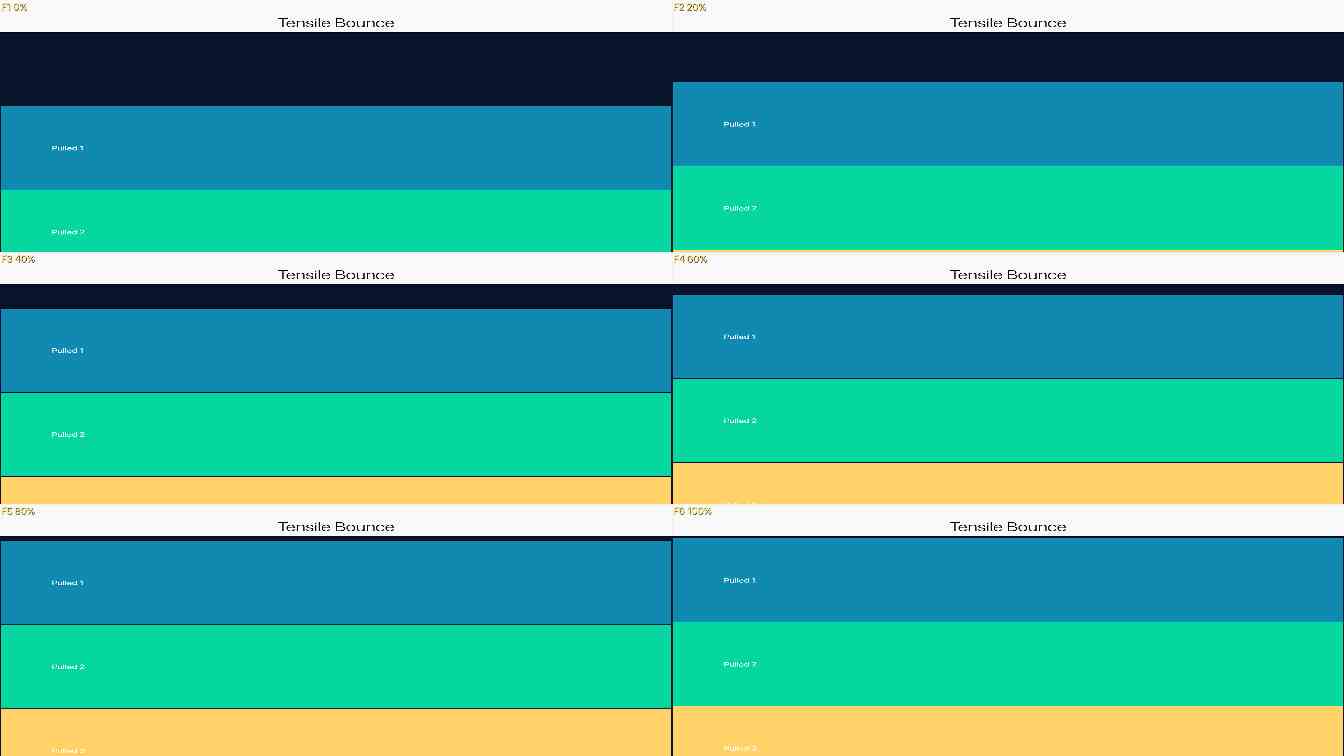
  • TensileBounceScreenshotTest — updated screenshot. Screenshot differs (3840x2160 px, bit depth 8).

    TensileBounceScreenshotTest
    Preview info: JPEG preview quality 30; JPEG preview quality 30; downscaled to 1344x756.
    Full-resolution PNG saved as TensileBounceScreenshotTest.png in workflow artifacts.

@shai-almog

shai-almog commented Nov 1, 2026 •

Copy link
Copy Markdown
Collaborator Author

Apple Watch (watchOS / Core Graphics)

Compared 253 screenshots: 247 matched, 2 updated, 4 missing references.

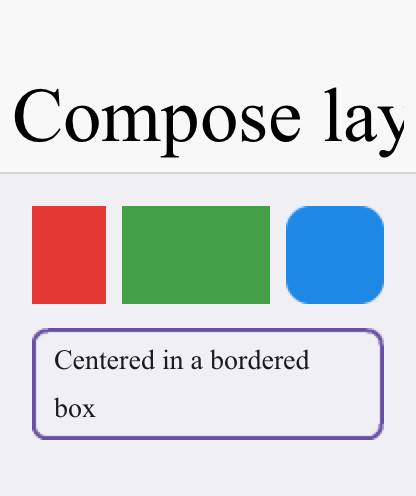
  • KmpCompatLayout — missing reference. Reference screenshot missing at /Users/runner/work/CodenameOne/CodenameOne/scripts/ios/screenshots-watch/KmpCompatLayout.png.

    KmpCompatLayout
    Preview info: JPEG preview quality 70; JPEG preview quality 70.
    Full-resolution PNG saved as KmpCompatLayout.png in workflow artifacts.

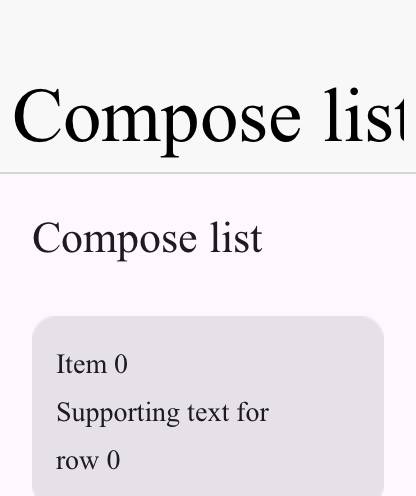
  • KmpCompatList — missing reference. Reference screenshot missing at /Users/runner/work/CodenameOne/CodenameOne/scripts/ios/screenshots-watch/KmpCompatList.png.

    KmpCompatList
    Preview info: JPEG preview quality 70; JPEG preview quality 70.
    Full-resolution PNG saved as KmpCompatList.png in workflow artifacts.

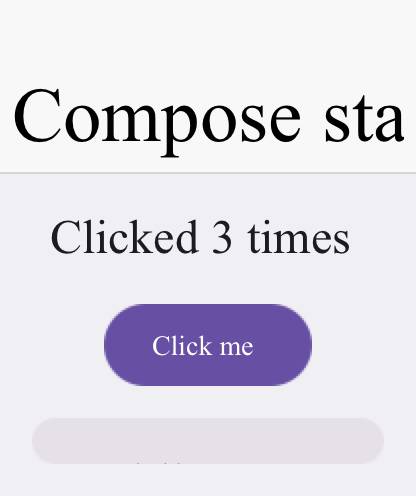
  • KmpCompatState — missing reference. Reference screenshot missing at /Users/runner/work/CodenameOne/CodenameOne/scripts/ios/screenshots-watch/KmpCompatState.png.

    KmpCompatState
    Preview info: JPEG preview quality 70; JPEG preview quality 70.
    Full-resolution PNG saved as KmpCompatState.png in workflow artifacts.

  • KmpCompatTypography — missing reference. Reference screenshot missing at /Users/runner/work/CodenameOne/CodenameOne/scripts/ios/screenshots-watch/KmpCompatTypography.png.

    KmpCompatTypography
    Preview info: JPEG preview quality 70; JPEG preview quality 70.
    Full-resolution PNG saved as KmpCompatTypography.png in workflow artifacts.

  • Sheet — updated screenshot. Screenshot differs (416x496 px, bit depth 8).

    Sheet
    Preview info: JPEG preview quality 70; JPEG preview quality 70.
    Full-resolution PNG saved as Sheet.png in workflow artifacts.

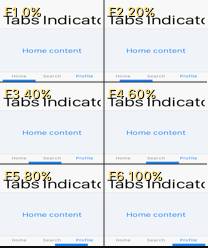
  • TabsAnimatedIndicatorScreenshotTest — updated screenshot. Screenshot differs (208x248 px, bit depth 8).

    TabsAnimatedIndicatorScreenshotTest
    Preview info: JPEG preview quality 70; JPEG preview quality 70.
    Full-resolution PNG saved as TabsAnimatedIndicatorScreenshotTest.png in workflow artifacts.

@shai-almog

shai-almog commented Nov 1, 2026 •

Copy link
Copy Markdown
Collaborator Author

Compared 192 screenshots: 192 matched.
✅ Native Mac screenshot tests passed.

Benchmark Results

  • VM Translation Time: 0 seconds
  • Compilation Time: 683 seconds

Detailed Performance Metrics

Metric Duration
SIMD kernel backend SSE2 (x64) / NEON (arm64) native kernels
SIMD int-add (64K x300) java 90ms / native 15ms = 6.0x speedup
SIMD float-mul (64K x300) java 49ms / native 2ms = 24.5x speedup
SIMD kernel correctness PASS (native result == scalar reference)
Base64 payload size 8192 bytes
Base64 benchmark iterations 6000
Base64 SIMD byte path active (NEON-accelerated)
Base64 CN1 encode 70.000 ms
Base64 CN1 decode 54.000 ms
Base64 native encode 659.000 ms
Base64 encode ratio (CN1/native) 0.106x (89.4% faster)
Base64 native decode 293.000 ms
Base64 decode ratio (CN1/native) 0.184x (81.6% faster)
Base64 SIMD encode 53.000 ms
Base64 encode ratio (SIMD/CN1) 0.757x (24.3% faster)
Base64 SIMD decode 48.000 ms
Base64 decode ratio (SIMD/CN1) 0.889x (11.1% faster)
Base64 encode ratio (SIMD/native) 0.080x (92.0% faster)
Base64 decode ratio (SIMD/native) 0.164x (83.6% faster)
Image encode benchmark iterations 100
Image createMask (SIMD off) 6.000 ms
Image createMask (SIMD on) 2.000 ms
Image createMask ratio (SIMD on/off) 0.333x (66.7% faster)
Image applyMask (SIMD off) 60.000 ms
Image applyMask (SIMD on) 74.000 ms
Image applyMask ratio (SIMD on/off) 1.233x (23.3% slower)
Image modifyAlpha (SIMD off) 50.000 ms
Image modifyAlpha (SIMD on) 55.000 ms
Image modifyAlpha ratio (SIMD on/off) 1.100x (10.0% slower)
Image modifyAlpha removeColor (SIMD off) 77.000 ms
Image modifyAlpha removeColor (SIMD on) 90.000 ms
Image modifyAlpha removeColor ratio (SIMD on/off) 1.169x (16.9% slower)

@shai-almog
shai-almog merged commit 1901fd5 into master Nov 1, 2026
194 of 200 checks passed
@shai-almog
shai-almog deleted the realtime-threads branch November 1, 2026 09:38
Sign up for free to join this conversation on GitHub. Already have an account? Sign in to comment

Labels

None yet

Projects

None yet

Development

Successfully merging this pull request may close these issues.

1 participant