Hi there,
My project team and I have found this package much more useful and intuitive than cowplot, so thank you!
We've been using patchwork to combine multiple plots into one figure. Our largest figure is a 3x3 grid where each plot is a combined 2x1 plot, so there's actually a total of 18 ggplot objects.
We were hoping to use the plot_layout(tag_level = 'new') feature to skip labeling our subplots, but the skipped subplots also skip the associated label letters. Here is a simplified example:
library(tidyverse)
library(patchwork)
p1 <- ggplot(mtcars) + geom_point(aes(mpg, disp)) + ggtitle("Main plot 1")
p2 <- ggplot(mtcars) + geom_boxplot(aes(gear, disp, group = gear)) + ggtitle("Main plot 2")
h1 <- ggplot(mtcars) + geom_histogram(aes(mpg)) + plot_layout(tag_level = 'new') + ggtitle("Subplot 1")
h2 <- ggplot(mtcars) + geom_histogram(aes(gear)) + scale_x_continuous(limits = c(2.5, 5.5), expand = c(0, 0)) + ggtitle("Subplot 2") + plot_layout(tag_level = 'new')
((p1 / h1) | (p2 / h2)) + plot_annotation(tag_levels = c('A'))
#> `stat_bin()` using `bins = 30`. Pick better value with `binwidth`.
#> `stat_bin()` using `bins = 30`. Pick better value with `binwidth`.
#> Warning: Removed 2 rows containing missing values (geom_bar).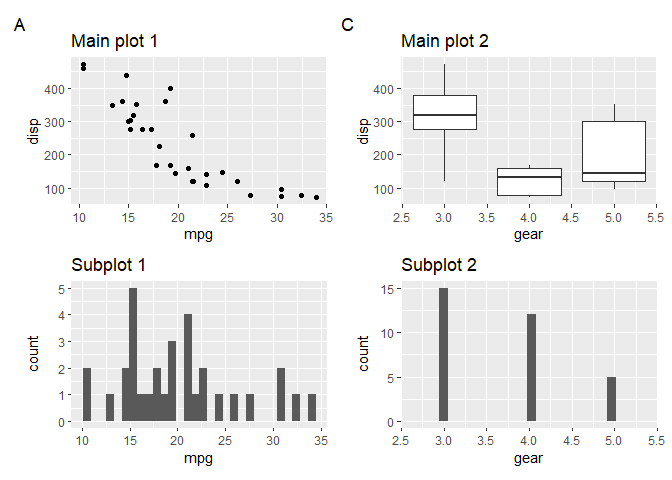
Created on 2020-01-17 by the reprex package (v0.3.0)
We've instead used ggplot2's labs(title = ) feature, like in the modified example below, to manually create labels for our nine plots, but were hoping for a simpler solution through patchwork.
library(tidyverse)
library(patchwork)
p1 <- ggplot(mtcars) + geom_point(aes(mpg, disp)) + ggtitle("Main plot 1")
p2 <- ggplot(mtcars) + geom_boxplot(aes(gear, disp, group = gear)) + ggtitle("Main plot 2")
h1 <- ggplot(mtcars) + geom_histogram(aes(mpg)) + plot_layout(tag_level = 'new') + ggtitle("Subplot 1")
h2 <- ggplot(mtcars) + geom_histogram(aes(gear)) + scale_x_continuous(limits = c(2.5, 5.5), expand = c(0, 0)) + ggtitle("Subplot 2")
(((p1 + labs(title = "A")) / h1) | ((p2 + labs(title = "B")) / h2))
#> `stat_bin()` using `bins = 30`. Pick better value with `binwidth`.
#> `stat_bin()` using `bins = 30`. Pick better value with `binwidth`.
#> Warning: Removed 2 rows containing missing values (geom_bar).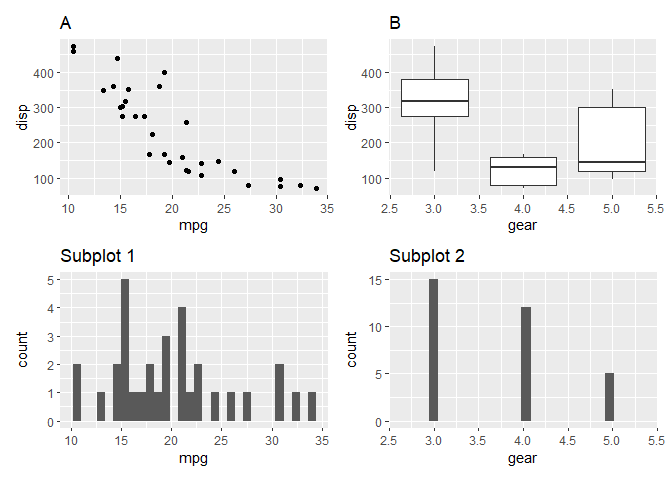
Created on 2020-01-17 by the reprex package (v0.3.0)
Hi there,
My project team and I have found this package much more useful and intuitive than
cowplot, so thank you!We've been using
patchworkto combine multiple plots into one figure. Our largest figure is a 3x3 grid where each plot is a combined 2x1 plot, so there's actually a total of 18ggplotobjects.We were hoping to use the
plot_layout(tag_level = 'new')feature to skip labeling our subplots, but the skipped subplots also skip the associated label letters. Here is a simplified example:Created on 2020-01-17 by the reprex package (v0.3.0)
We've instead used
ggplot2'slabs(title = )feature, like in the modified example below, to manually create labels for our nine plots, but were hoping for a simpler solution throughpatchwork.Created on 2020-01-17 by the reprex package (v0.3.0)